
Figures & data
Table 1. Summary of studies in ruminants fed AsparagopsisFootnotea with details of the studies, and the methane response (reduction) expressed per mg of bromoform.
Figure 1. The relationship between the reduction in methane emissions and the bromoform intake for five sets of data (the full data are in ).
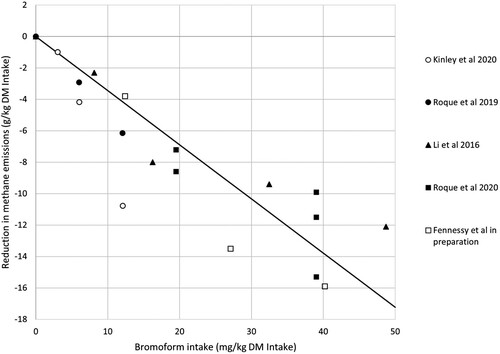
Table 2. Estimated dietary exposure from bromoform for a 70 kg adult based on reported background values in milk from untreated animals and with allowance for drinking water standards.