Figures & data
© 2024 The Author(s). Published by Informa UK Limited, trading as Taylor & Francis Group
Table 1. Details of the four Northland units used to group the grass datasets.
Table 2. Grass species, Northland unit (Kaitaia = 1; Kaikohe = 2; Whangarei = 3, Dargaville = 4), cultivars, and the reference details from the gathered datasets from Northland.
Figure 1. Percentage (%) of the total gathered datapoints from Northland grass species. ‘Others’ correspond to Limpo grass, Meadow fescue, Nile grass, Prairie grass and Weeping love grass.
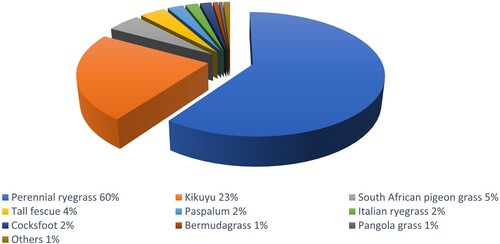
Figure 2. Mean monthly growth rate (kg DM/ha/d) of perennial ryegrass dominant pastures at sites near Kaitaia (A), Kaikohe (B), Whangarei (C), and Dargaville (D). The error bar represents the pooled mean standard deviation. This figure was generated from 14 published and 3 unpublished datasets (https://www.agyields.co.nz, see Supplement 1 for details) (Baars Citation1976; Steele Citation1976; Piggot et al. Citation1978; Goold Citation1980; Ledgard et al. Citation1982; Rumball Citation1983; Taylor and Hunt Citation1983).
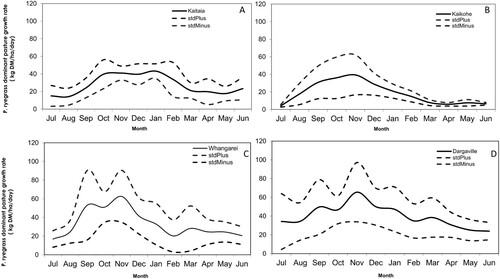
Figure 3. Mean monthly growth rate (kg DM/ha/d) of Italian ryegrass dominant pastures in Kaitaia, Whangarei and Dargaville. The error bar represents the pooled (sites x year) mean standard deviation. Figure generated from 1 published dataset (Wynn et al.,2011, https://www.agyields.co.nz/dataset/215) and 1 unpublished dataset (Ussher, G., https://www.agyields.co.nz/dataset/449).
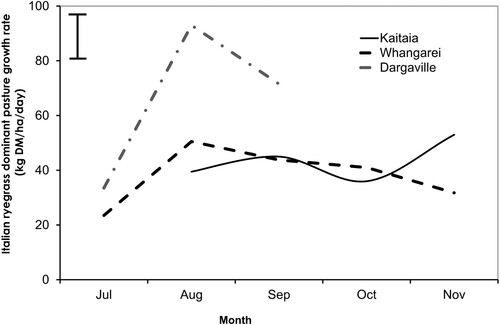
Figure 4. Mean monthly growth rate (kg DM/ha/d) of cocksfoot dominant pastures at Kaikohe. Average ± 1 standard deviation lines (StdPlus, StdMinus) are shown. Figure generated from 1 published dataset (Lambert et al. Citation1973, https://www.agyields.co.nz/dataset/248).
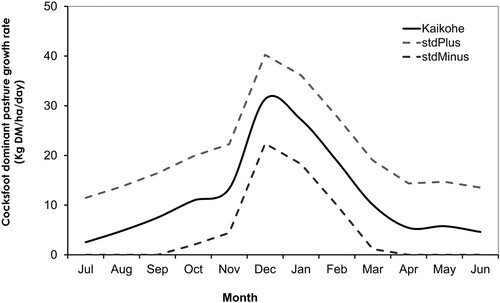
Figure 5. Mean monthly growth rate (kg DM/ha/d) of tall fescue dominant pastures at Kaitaia (A), Whangarei (B), and Dargaville (C). The error bar represents the pooled (sites x year) standard deviation. Kaitaia and Whangarei data for July, September, November, January, March, May months. Figure generated from 1 published dataset (McCahon et al. Citation2021; https://www.agyields.co.nz/dataset/154) and 1 unpublished dataset (Ussher G; https://www.agyields.co.nz/dataset/377).
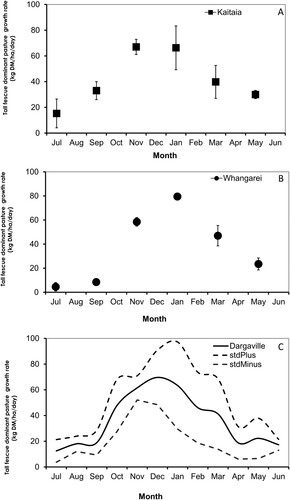
Figure 6. Mean monthly growth rate (kg DM/ha/d) of kikuyu dominant pastures at Kaitaia (A), Whangarei (B), and Dargaville (C). The error bar represents the pooled (sites x year) mean standard deviation. Figure generated from 6 published datasets including Piggot and Morgan (Citation1987) and 4 unpublished datasets (https://www.agyields.co.nz, see Supplement 1 for details).
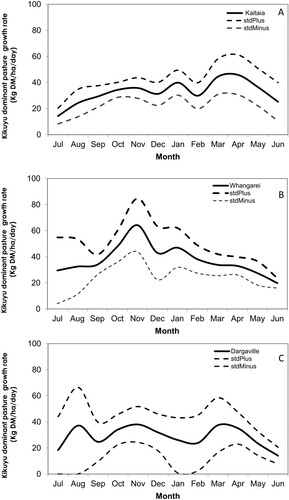
Figure 7. Growth rates of a kikuyu based pasture at Dargaville (no nitrogen treatments). Data digitised from in Piggot (Citation1988). Cages placed 5 times per year and herbage cut twice afterwards. Spline curve based on Cut 2 data to highlight the seasonal growth pattern.
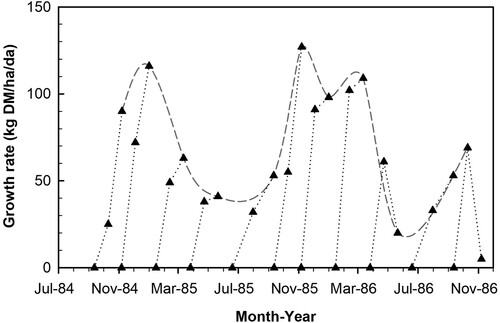
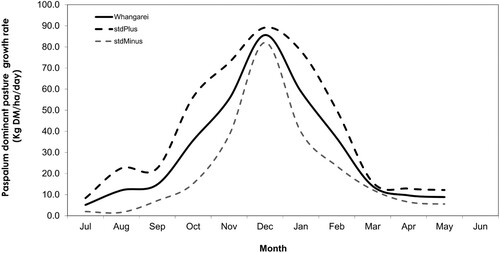
Figure 8. Mean monthly growth rate (kg DM/ha/d) of paspalum dominant pastures at Whangarei. Average ± 1 standard deviation lines (StdPlus, StdMinus) are shown Figure generated from Piggot (Citation1984), https://www.agyields.co.nz/dataset/223.