Figures & data
Figure 1. Location of the 12 sites from where capsules of Leptospermum scoparium were collected. Sites with closed circles have experienced fire since c. 3000 yr BP and those with open circles since human settlement in c. 1280 (Battersby Citation2014). Flammability experiments were conducted on material from all sites except Kai Iwi Lakes.
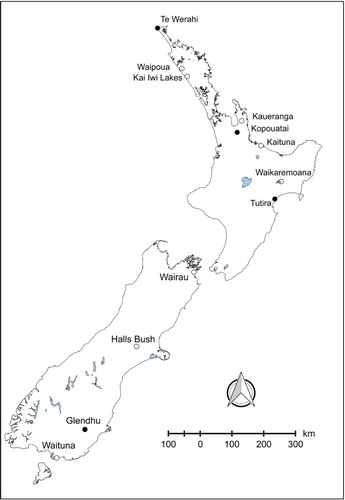
Table 1. Summary of general linear mixed models of effects of heat shocking on seed germination (‘germinability’) and rate of germination.
Figure 2. A, Pooled effect of heating (blue = unheated vs red = heated) on Leptospermum scoparium seeds across all populations; B, effects of heating on germination rate of seeds of L. scoparium. Heavy lines are means and shaded areas ± 1 SD pooled across all populations.
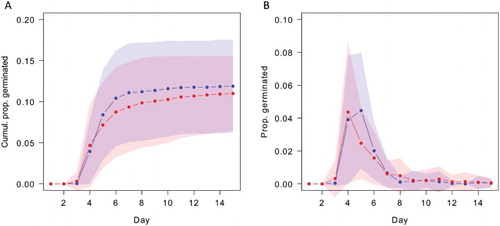
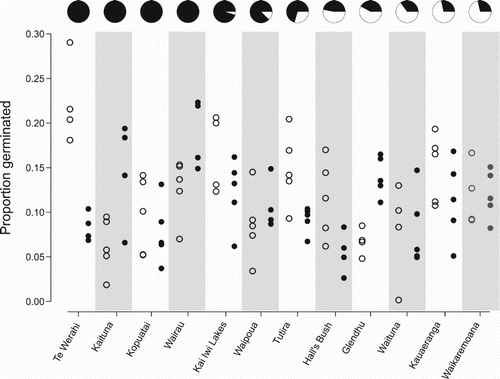
Figure 3. Effects of heating for individual sites. Open dots represent no heat-treatment replicates and closed dots represent heat-treated replicates. Note the high level of variability in germinability both within and between sites. The pie charts above each site show the proportion of serotinous individuals (> 60% closed capsules) at that site (in black), and sites are in descending order of prevalence of serotiny (left to right).