Figures & data
Fig. 1 (A) Map of New Zealand depicting the location of Tucker Hill; (B) map of section of the South Island of New Zealand showing the location of Tucker Hill relative to key geographical features and the locations of the Cromwell Gorge Shear Zone (CGSZ), Rise and Shine Shear Zone (RSSZ) and Hyde-Macraes Shear Zone (HMSZ) (after Deckert et al. Citation2002); (C) generalized regional geology map of the area around Tucker Hill (after Barker Citation2005); and (D) map showing key structural features and measurements made at Tucker Hill and the location of the sample collected for geochronology (after Barker Citation2005).
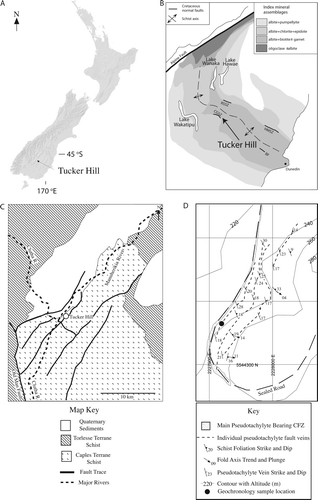
Fig. 2 (A) Typical thick (c. 1 cm thick) pseudotachylyte vein in outcrop formed of schist host rock (pen 15 cm long for scale, with pseudotachylyte vein at pen tip). (B) Thickest pseudotachylyte vein found at Tucker Hill (c. 5 cm thick) examined in thin section. Note several sets of chill margins and quartz lithic clasts. Ruler (cm markings) for scale. (C) Photomicrograph showing a typical margin of a pseudotachylyte vein. Note numerous lithic clasts, especially in margin of vein. Tiny potassium feldspar microlites (10 µm scale) can be seen in right side of photomicrograph (away from chill margin).
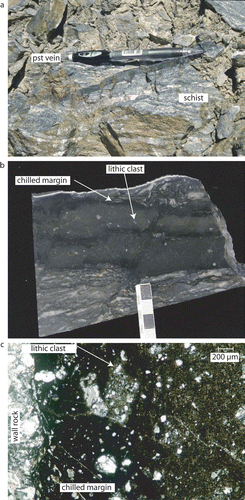
Fig. 3 (A) SEM backscattered electron photomicrograph showing a typical fractured quartz lithic clast. Note lighter grey melt phase infilling crack and barren crack (darkest grey, from top of lithic clast). (B) Photomicrograph in plane polarised light showing a blurry rimmed lithic clast, surrounded by a fine-grained matrix composed mainly of chlorite. (C) SEM photomicrograph showing an indistinct rimmed plagioclase lithic clast, onto which potassium feldspar microlites are growing. Chlorite forms the majority of the surrounding matrix material.
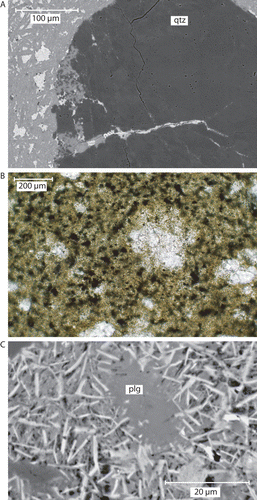
Fig. 4 TEM brightfield photomicrograph showing a mat of fine-grained chlorite in a matrix area of pseudotachylyte.
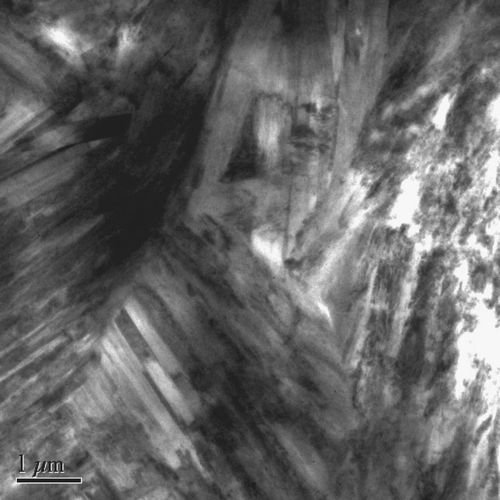
Fig. 5 (A) Photomicrograph in plane polarised light showing spheroids in OU 74178. Note dark black graphite rim on edge of spheroids and titanite growing from edges of spheroid towards centre. (B) SEM backscattered electron photomicrograph showing radial morphology of a titanite grain contained within a spheroid. Titanite appears to nucleate from a point on the bottom right of photomicrograph. (C) Photomicrograph in plane polarised light showing spheroids in OU 74178. Note zoning within titanites and both quartz (dominant infilling material in large, central spheroid) and potassium feldspar (right-hand side of large, central spheroid).
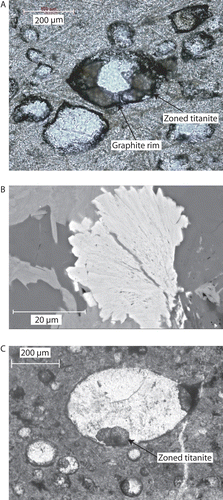
Table 1 Major element (wt%) concentrations for schist and pseudotachylyte from XRF analyses
Fig. 6 (A) Comparison of pseudotachylyte and schist major element XRF compositions, calculated as R, the ratio of a trace element in pseudotachylyte compared to schist. To illustrate the size and significance of these compositional variations between pseudotachylyte and host schist, concentration ratios have been calculated with errors included using standard propagation techniques (see text for details). (B) Comparison of pseudotachylyte and schist trace element X-ray fluorescence composition. Note depletions in Ga, As, Sr, and Y, and enrichments in Rb, Ba, and Nb (in pseudotachylyte relative to schist).
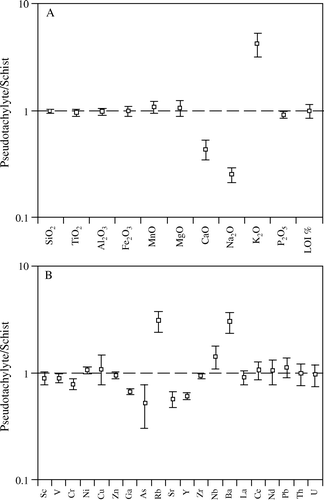
Table 2 Trace element (mg/kg) composition of schist and pseudotachylyte from XRF analyses
Fig. 7 (A) Comparison of pseudotachylyte and schist trace element compositions as determined by laser ablation, inductively couple plasma mass spectrometry. Note Rb and Ba enrichments, and significant depletions in Sr and Eu. (B) Chrondite normalised REE plot of schist and pseudotachylyte (as determined by LA-ICP-MS). Note significant Eu anomaly, which is only present in pseudotachylyte.
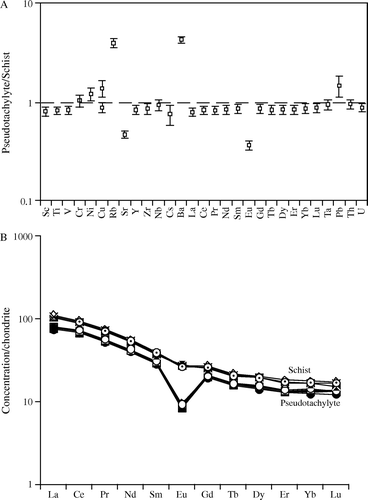
Table 3 Trace element composition (mg/kg) of pseudotachylyte and schist whole rock glasses as determined by LA-ICP-MS for separate spot analyses carried out on fused samples for elements Sc to La and Ce to U
Fig. 8 (A) Ar-Ar age spectra for encapsulated stepwise heated sample of ‘intact rock’ pseudotachylyte matrix and (B) Ar-Ar age spectra for unencapsulated stepwise heated sample of pseudotachylyte matrix.
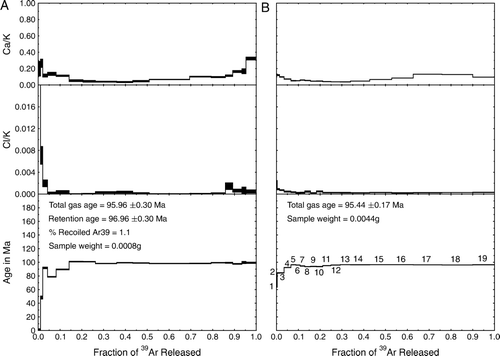
Table 4 Data obtained for Ar-Ar dating during step-heating analysis of the encapsulated sample. Volumes are given in ccSTP/g×1013 (i.e. a value of 1 in the table is actually 1×10⁻¹³)
Table 5 Data obtained for Ar-Ar dating during step-heating analysis of the non-encapsualted sample. Volumes are given in ccSTP/g×1013 (i.e. a value of 1 in the table is actually 1×10⁻¹³)
Table 6 Results from laser ablation Ar-Ar analyses
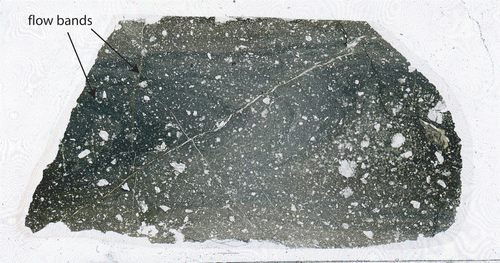
Fig. 9 Thin section of OU 74177 displaying flow banding (section length 50 mm).