1,599
Views
38
CrossRef citations to date
0
Altmetric
Articles

Preferential oxidation of pyrite as a function of morphology and relict texture

&
Pages 167-176 | Received 19 Oct 2009, Published online: 27 Sep 2010

Figures & data

Fig. 1 Generalised stratigraphic column for the Stockton area, West Coast, New Zealand. The circled area is the area of interest, representing the lithological units present at Stockton Coal Mine.
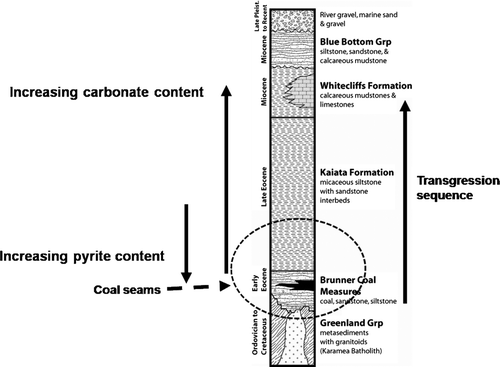
Fig. 1  Generalised stratigraphic column for the Stockton area, West Coast, New Zealand. The circled area is the area of interest, representing the lithological units present at Stockton Coal Mine.

Fig. 2 Distribution of average total sulphur content in lithological units from the Brunner Coal Measures. CSS-coarse sandstones, FSS and ZSS- fine sandstones and siltstones, MST-mudstones. The upper whisker shows the highest data value within the upper limit. The top the box of represents the third quartile. The median is the middle of the data and is shown by the line within the shaded box. The bottom of the box represents the 1st quartile. Asterisks denote outliers, the number of S analyses used to make this figure is >100.
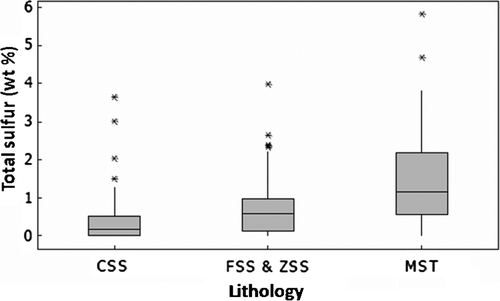
Fig. 2  Distribution of average total sulphur content in lithological units from the Brunner Coal Measures. CSS-coarse sandstones, FSS and ZSS- fine sandstones and siltstones, MST-mudstones. The upper whisker shows the highest data value within the upper limit. The top the box of represents the third quartile. The median is the middle of the data and is shown by the line within the shaded box. The bottom of the box represents the 1st quartile. Asterisks denote outliers, the number of S analyses used to make this figure is >100.

Fig. 3 Humidity cell design for the experiments performed on the sample mudstone. (AD) show the experimental apparatus and humidity generator consisting of a series of heat lamps and forced air bubbling apparatus (D). (EG) show a close-up view of the humidity cells containing the planar slides and crushed rock material that was exposed to the high humidity condition. (H) shows moisture permeating the entire cell.
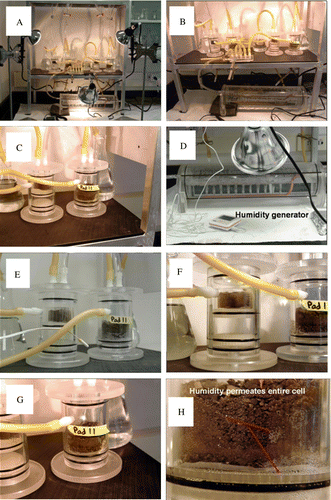
Fig. 3  Humidity cell design for the experiments performed on the sample mudstone. (A–D) show the experimental apparatus and humidity generator consisting of a series of heat lamps and forced air bubbling apparatus (D). (E–G) show a close-up view of the humidity cells containing the planar slides and crushed rock material that was exposed to the high humidity condition. (H) shows moisture permeating the entire cell.

Table 1  Leachate analysis for the BCM crushed rock sample (390 days)

Fig. 4 Successive alteration on the surface of pyrite over a 210 day period was identified from the exposed polished planar slide contained in the humidity cell. (A) After 30 days visible alteration is observed on the pyrite surfaces with the formation of circular zones of secondary precipitation. (B) After 60 days surface alteration products appear to coalesce forming pronounced islands of sulphur; note the diffuse circular region below the secondary mineralised areas resembling ‘relict framboid’ morphology. (CD), secondary mineralisation continues to form covering the majority of the exposed pyrite.

Fig. 4  Successive alteration on the surface of pyrite over a 210 day period was identified from the exposed polished planar slide contained in the humidity cell. (A) After 30 days visible alteration is observed on the pyrite surfaces with the formation of circular zones of secondary precipitation. (B) After 60 days surface alteration products appear to coalesce forming pronounced islands of sulphur; note the diffuse circular region below the secondary mineralised areas resembling ‘relict framboid’ morphology. (C–D), secondary mineralisation continues to form covering the majority of the exposed pyrite.
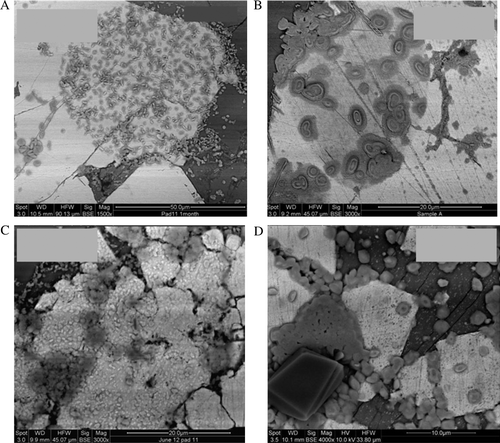
Fig. 5 Comparison of progressive oxidation associated with the two pyrite morphologies associated with the crushed rock (not planar slides) contained within the humidity cell after 210 days. Magnifications as shown. (A) shows the percentage alteration observed with the euhedral forms of pyrite and shows successive dissolution textures culminating in c. 40% removal of the perimeter area of iron sulfide. (B) shows the sequential alteration of the framboidal fine grained pyrite culminating in a 90% to 100% alteration or replacement after 210 days.
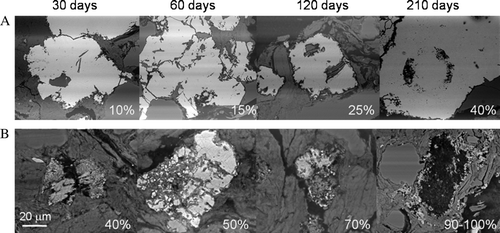
Fig. 5  Comparison of progressive oxidation associated with the two pyrite morphologies associated with the crushed rock (not planar slides) contained within the humidity cell after 210 days. Magnifications as shown. (A) shows the percentage alteration observed with the euhedral forms of pyrite and shows successive dissolution textures culminating in c. 40% removal of the perimeter area of iron sulfide. (B) shows the sequential alteration of the framboidal fine grained pyrite culminating in a 90% to 100% alteration or replacement after 210 days.

Fig. 6 Elemental distributions from a pyrite grain after 120 day exposure show associated alteration zones. (A) iron (yellow), potassium (red), silicon (blue). (B) Shows the BSE image.
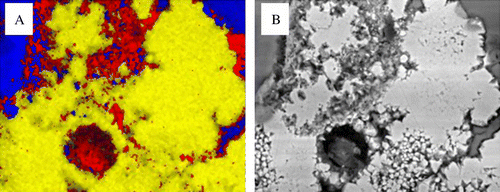
Fig. 6  Elemental distributions from a pyrite grain after 120 day exposure show associated alteration zones. (A) iron (yellow), potassium (red), silicon (blue). (B) Shows the BSE image.

Table 2  Degree of alteration associated with the pyrite morphologies in BCM mudstone sample

Fig. 7 BSE micrographs collected from prepared thin sections of the crushed material show evidence of zonation within the euhedral pyrite grains after 390 days exposure in a humidity cell. Note different scales. (A) 100 µm, (B) 50 µm, (C) 20 µm, (D) 20 µm.
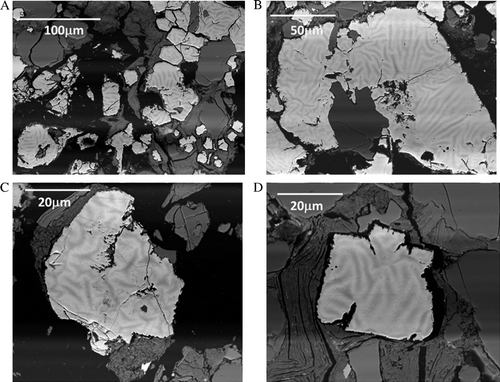
Fig. 7  BSE micrographs collected from prepared thin sections of the crushed material show evidence of zonation within the euhedral pyrite grains after 390 days exposure in a humidity cell. Note different scales. (A) 100 µm, (B) 50 µm, (C) 20 µm, (D) 20 µm.

Fig. 8 Chemical maps of zoned pyrite after 390 day exposure. (A) BSE micrograph showing the distribution and phase contrast of low Z elements. (B) Elemental map of oxygen enrichment associated with the dark phase contrast network shown in (A), note the perforated circled area.
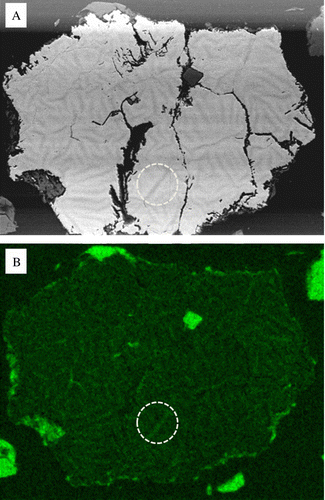
Fig. 8  Chemical maps of zoned pyrite after 390 day exposure. (A) BSE micrograph showing the distribution and phase contrast of low Z elements. (B) Elemental map of oxygen enrichment associated with the dark phase contrast network shown in (A), note the perforated circled area.

Fig. 9 Comparison of samples showing preferential dissolution of the euhedral pyrite collected after: (AB) 390 days; (CD) 480 days; and (EF) 720 days. After 390 days (top AB) pyritic overgrowth texture is gradually dissolved showing residual framboid structure within the euhedral pyrite. After 480 days (middle CD) strong dissolution features are observed within the euhedral pyrite grains. After 720 days (bottom EF) pyrite grains show continued dissolution along zones of preferential oxidation features similar to those shown in , .
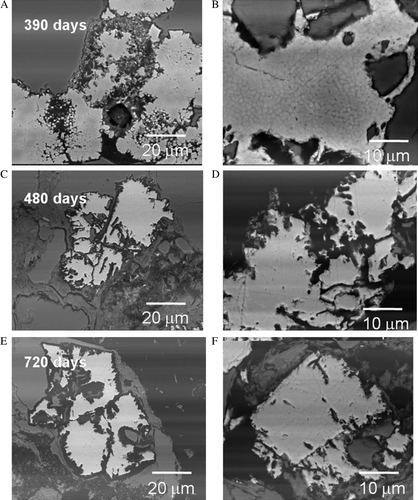
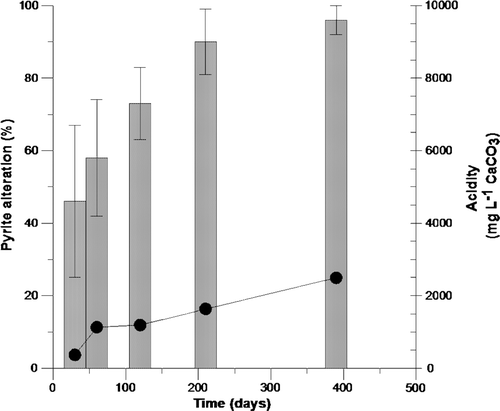
Fig. 9  Comparison of samples showing preferential dissolution of the euhedral pyrite collected after: (A–B) 390 days; (C–D) 480 days; and (E–F) 720 days. After 390 days (top A–B) pyritic overgrowth texture is gradually dissolved showing residual framboid structure within the euhedral pyrite. After 480 days (middle C–D) strong dissolution features are observed within the euhedral pyrite grains. After 720 days (bottom E–F) pyrite grains show continued dissolution along zones of preferential oxidation features similar to those shown in Figs. 7, 8.

Fig. 10 Framboidal pyrite alteration (bar graph) versus cumulative acid release (line graph) for BCM mudstone during the humidity cell experiment.

Fig. 10  Framboidal pyrite alteration (bar graph) versus cumulative acid release (line graph) for BCM mudstone during the humidity cell experiment.

Reprints and Corporate Permissions

Please note: Selecting permissions does not provide access to the full text of the article, please see our help page How do I view content?

To request a reprint or corporate permissions for this article, please click on the relevant link below:

Academic Permissions

Please note: Selecting permissions does not provide access to the full text of the article, please see our help page How do I view content?

Obtain permissions instantly via Rightslink by clicking on the button below:

If you are unable to obtain permissions via Rightslink, please complete and submit this Permissions form. For more information, please visit our Permissions help page.