Figures & data
Figure 1 Location map of the Otago Schist and adjacent low-grade rocks, showing the localities described in the text (section lines in are indicated with grey boxes) in relation to the metamorphic transition on the northeast side of the schist belt. Cretaceous normal faults responsible for condensing the metamorphic section are indicated: WFZ, Waihemo Fault Zone; BLFZ, Blue Lake Fault Zone (as in A, B).
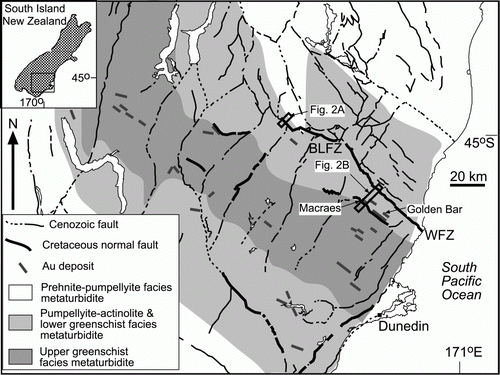
Figure 2 Sketch cross-sections through the metamorphic transition on the northeast side of the Otago Schist belt, to show relationships between the localities described in the text. A, Section through the Blue Lake Fault Zone exposed in the gorge of the Manuherikia River, showing the low-grade turbidites (right; A) in relation to the lower greenschist facies schists (left). Samples for this study were collected near the northeastern edge of this section. B, Section across the Hyde-Macraes Shear Zone in lower greenschist facies rocks, in relation to higher and lower grade rocks.
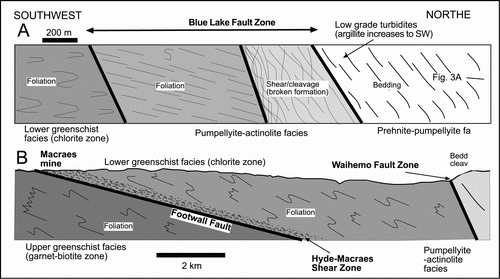
Figure 3 Structural and lithological setting of sample collection sites for this study. A, Cross-section through the low-grade turbidites sampled for framboidal pyrite. B, Outcrop photograph of thin-bedded turbidites (grid reference NZTM 1354334 5024550) that contain framboidal pyrite. Bedding is near-vertical; Mdst, mudstone; Sst, sandstone; Sltst, siltstone. C, Photograph of sawn face of a hand specimen from the graphitic micaceous shear (GMS) in the Golden Bar pit, Macraes mine (grid reference NZTM 1407243 4968355). Black shear seams anastomose through the rock and disrupt micaceous laminae (dark) and metamorphic quartz–albite segregations (MQ). Circled white dots are prominent pyrite porphyroblasts (Py). D, Sketch cross-section through the base of the Golden Bar pit (partly after Jones et al. 2007), showing the sampled graphitic micaceous shear in relation to other mineralized features.
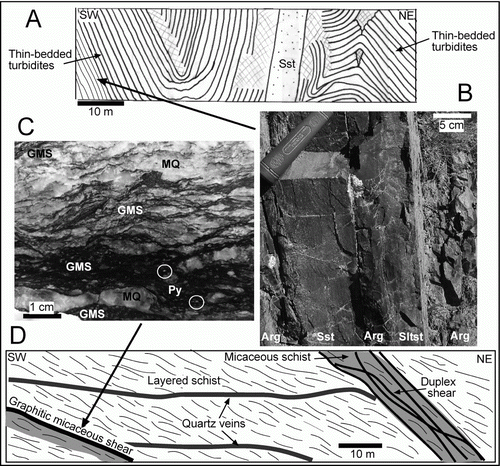
Figure 4 Scanning electron images of pyrite framboids (white) in low-grade turbidite samples, with LA-ICP-MS spot analyses indicated (all in ppm). A, B, Mudstones. C, Siltstone. D, Sandstone.
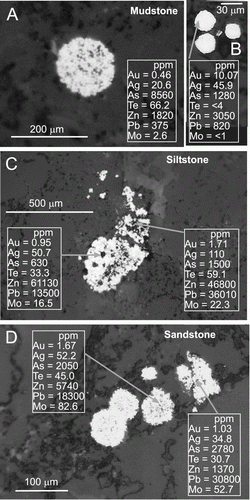
Figure 5 Geochemical plots of LA-ICP-MS spot analyses of framboidal pyrite in turbidites (□) and porphyroblastic pyrite from Macraes mine (•). All scales are logarithmic. A, As vs Au. B, Ag vs Au. C, W vs Au. D, Te vs Au. E, Ag vs Mo. F, Zn vs Pb.
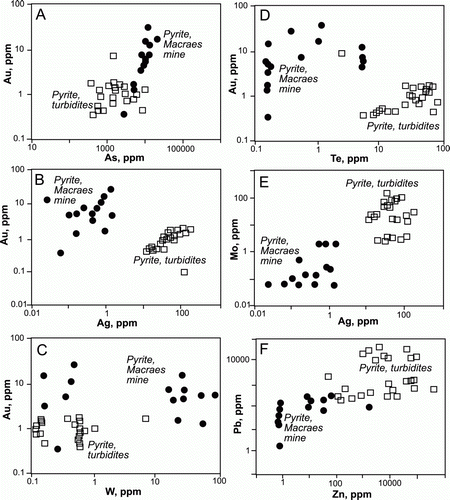
Figure 6 Scanning electron image (upper) of a siltstone across which a LA-ICP-MS scan obtained elemental variations (lower).
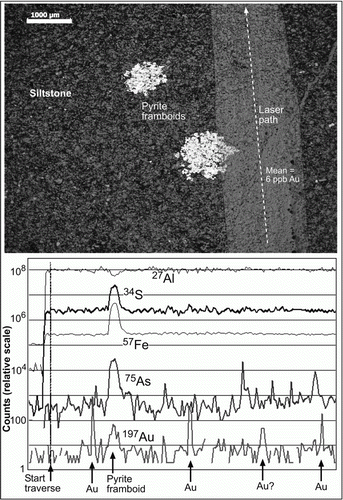
Figure 7 Scanning electron image (upper) of boundary between a sandstone (left) and mudstone (right) across which a LA-ICP-MS scan obtained elemental variations (lower).
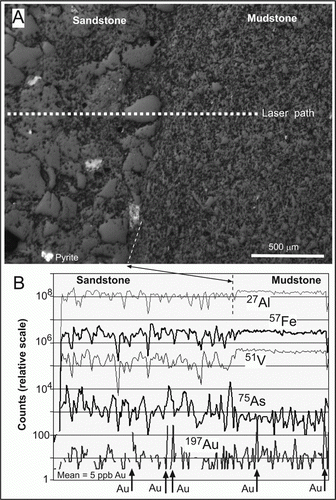
Figure 8 Textures and compositions of some pyrite porphyroblasts from a graphitic micaceous shear at Golden Bar pit, Macraes mine. LA-ICP-MS spot analyses for Au, As and W are in ppm; P1, P2, P3 refer to specific growth generations mentioned in the text. A, B, Scanning electron images of etched porphyroblasts, showing several growth zones. C, LA-ICP-MS traverse across part of the porphyroblast in B (thick white line). D, Scanning electron image of a pyrite porphyroblast. E, LA-ICP-MS Au map at the same scale as image in D. Colour scale is relative and logarithmic, with lowest concentrations in shades of black and blue, and highest concentrations in shades of red and orange. Red zone (lower left) is a native gold grain.
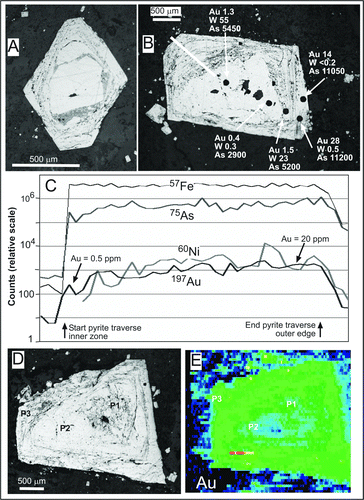
Figure 9 Texture and composition of a pyrite porphyroblast with growth zones (P1, P2, P3), with LA-ICP-MS spot analyses (Au, W = ppm; As = wt%). A, Scanning electron image B, Gold map at the same scale as in A, overlain with interpreted growth generation boundaries (dotted black lines, P1; solid black lines, P2). A suite of smaller scale LA-ICP-MS maps of the same porphyroblast (elements indicated) is depicted on the right. Colour scales for all LA-ICP-MS maps are relative and logarithmic, with lowest concentrations in shades of black and blue, and highest concentrations in shades of red and orange.

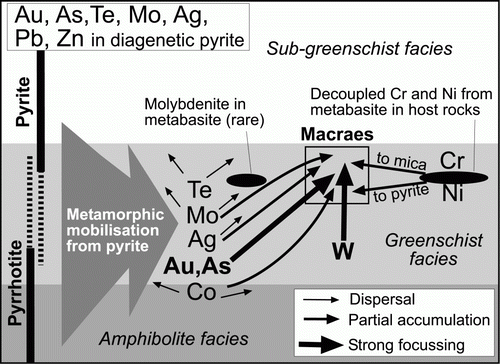
Figure 10 Summary conceptual diagram, depicting prograde metamorphic mobilisation of metals from diagenetic pyrite as it was transformed to pyrrhotite. The Au and As are concentrated in a Macraes-like structure, and other elements are partially dispersed. Tungsten, Cr, and Ni have different pathways from the host rocks (see text).