1,398
Views
23
CrossRef citations to date
0
Altmetric
Articles

Tectonic controls on the evolution of the Clutha River catchment, New Zealand

, , , &
Pages 345-359 | Received 13 Jan 2012, Accepted 06 Jun 2012, Published online: 24 Sep 2012

Figures & data

Figure 1 A, DEM image(used with permission of www.geographx.co.nz) of the southern South Island showing the underlying crustal blocks and their relative crustal strengths. B, Geological terrane map of southern South Island (partly after Mortimer Citation1993; Turnbull Citation2000; Forsyth Citation2001) showing sources of principal rock types relevant to sediment provenance during evolution of the Clutha catchment. Dotted lines show margins of schist belt. Heavy dashed line shows the southern portion of the Miocene lamprophyre dyke swarm (after Cooper et al. Citation1987). The present Clutha River main stem is shown in blue.
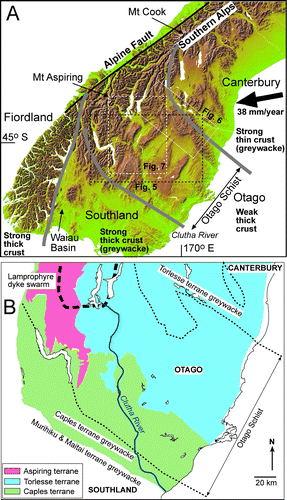
Figure 1  A, DEM image(used with permission of www.geographx.co.nz) of the southern South Island showing the underlying crustal blocks and their relative crustal strengths. B, Geological terrane map of southern South Island (partly after Mortimer Citation1993; Turnbull Citation2000; Forsyth Citation2001) showing sources of principal rock types relevant to sediment provenance during evolution of the Clutha catchment. Dotted lines show margins of schist belt. Heavy dashed line shows the southern portion of the Miocene lamprophyre dyke swarm (after Cooper et al. Citation1987). The present Clutha River main stem is shown in blue.

Table 1  Summary of principal river capture and drainage reorientation events during Quaternary evolution of the Clutha River catchment in Otago, New Zealand. Locations of numbered capture points and abandoned gaps are shown in , .

Figure 2 A, Shaded topographic image of southern South Island with principal rivers (blue) showing the Clutha River catchment boundary (dashed black line); the main stem of the Clutha River is enhanced in blue. Some of the principal faults that have affected topographic development are indicated with red lines (from Turnbull Citation2000; Forsyth Citation2001; Cox & Barrell Citation2007). Von-Ōreti River capture area (13A,C; ) is indicated. B, Inferred middle Quaternary palaeodrainage geometry for the same region as depicted in A, derived from observations and references in . Rivers are colour-coded for different catchments. The present Clutha River main stem is shown in pale blue for comparison.
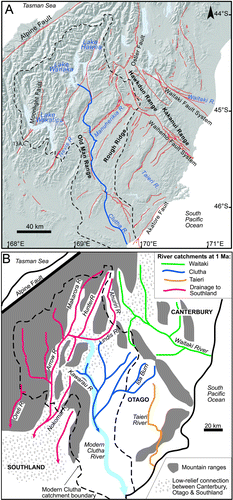
Figure 2  A, Shaded topographic image of southern South Island with principal rivers (blue) showing the Clutha River catchment boundary (dashed black line); the main stem of the Clutha River is enhanced in blue. Some of the principal faults that have affected topographic development are indicated with red lines (from Turnbull Citation2000; Forsyth Citation2001; Cox & Barrell Citation2007). Von-Ōreti River capture area (13A,C; Table 1) is indicated. B, Inferred middle Quaternary palaeodrainage geometry for the same region as depicted in A, derived from observations and references in Table 1. Rivers are colour-coded for different catchments. The present Clutha River main stem is shown in pale blue for comparison.

Figure 3 Tectonic stratigraphic columns for Miocene–Recent sedimentary sequences in central Otago and Southland, with their provenances indicated. The columns are generalised for these two areas, and do not represent specific localities. The evolution of the Clutha River catchment in this context is indicated in a box. Time axis is not to scale.
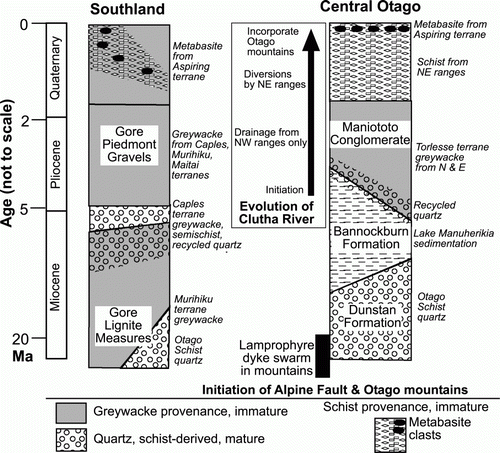
Figure 3  Tectonic stratigraphic columns for Miocene–Recent sedimentary sequences in central Otago and Southland, with their provenances indicated. The columns are generalised for these two areas, and do not represent specific localities. The evolution of the Clutha River catchment in this context is indicated in a box. Time axis is not to scale.

Figure 4 Map view of results of a numerical model of topographic development in heterogeneous crust with an inherited crustal boundary at a high angle to a transpressional plate boundary (plate vector indicated). Model topographic results adapted from models with boundary conditions defined by Upton et al. (Citation2009). Resultant uplift zones relevant to Otago are 1: mountains parallel to the plate boundary; 2: range perpendicular to the plate boundary at the crustal discontinuity (horizontal dotted arrow); and 3: ranges emanating perpendicular to 2 (parallel to vertical dotted arrow). Model space is equivalent to Canterbury and Otago crustal blocks (A), with the right margin equivalent to Otago east coast.
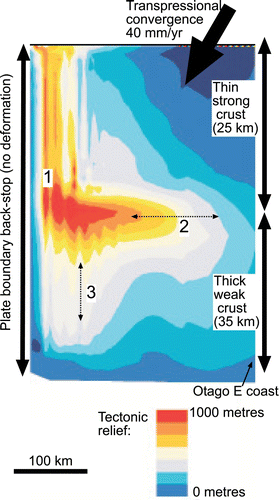
Figure 4  Map view of results of a numerical model of topographic development in heterogeneous crust with an inherited crustal boundary at a high angle to a transpressional plate boundary (plate vector indicated). Model topographic results adapted from models with boundary conditions defined by Upton et al. (Citation2009). Resultant uplift zones relevant to Otago are 1: mountains parallel to the plate boundary; 2: range perpendicular to the plate boundary at the crustal discontinuity (horizontal dotted arrow); and 3: ranges emanating perpendicular to 2 (parallel to vertical dotted arrow). Model space is equivalent to Canterbury and Otago crustal blocks (Fig. 1A), with the right margin equivalent to Otago east coast.

Figure 5 DEM of central Otago showing principal rivers and ranges mentioned in the text and points relevant to river capture events (; red numbers).
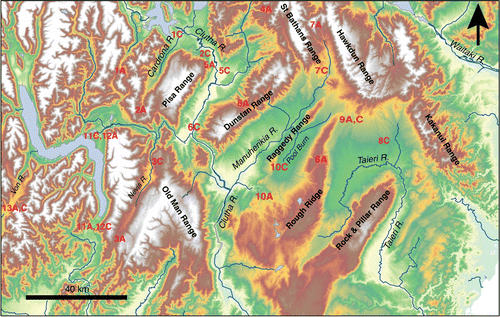
Figure 5  DEM of central Otago showing principal rivers and ranges mentioned in the text and points relevant to river capture events (Table 1; red numbers).

Figure 6 DEM of the NW-trending Hawkdun, St Bathans and Kakanui ranges showing points relevant to river capture events (; red numbers). Black lines are Cretaceous normal faults that have been locally reactivated as reverse faults. DP: Dansey Pass.
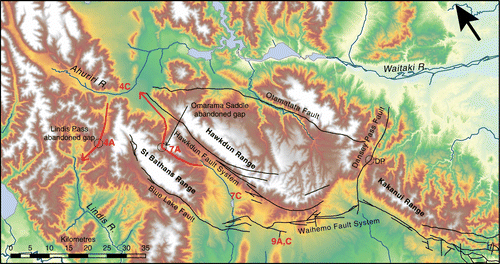
Figure 6  DEM of the NW-trending Hawkdun, St Bathans and Kakanui ranges showing points relevant to river capture events (Table 1; red numbers). Black lines are Cretaceous normal faults that have been locally reactivated as reverse faults. DP: Dansey Pass.

Figure 7 DEM showing south-western drainage pattern in the Pliocene and early Quaternary. Major drainages flow to the south. Red numbers show points relevant to river capture events (). Dashed line shows the approximate geometry of glacial moraine (after Turnbull Citation2000) that was instrumental in the redirection of the Clutha River from a route through Thomson Saddle (6A) to its present-day route through the Cromwell Gorge (6C).
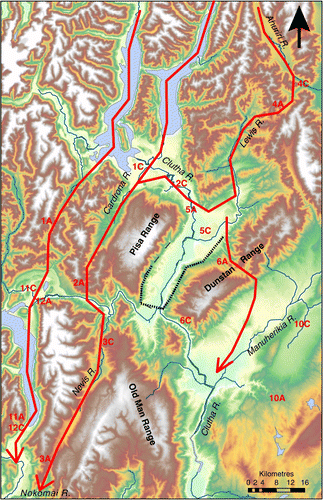
Figure 7  DEM showing south-western drainage pattern in the Pliocene and early Quaternary. Major drainages flow to the south. Red numbers show points relevant to river capture events (Table 1). Dashed line shows the approximate geometry of glacial moraine (after Turnbull Citation2000) that was instrumental in the redirection of the Clutha River from a route through Thomson Saddle (6A) to its present-day route through the Cromwell Gorge (6C).

Figure 8 Summary evolutionary trees (after Burridge et al. Citation2006, Citation2007, Citation2008; Craw et al. Citation2007a, Citationb; Waters et al. Citation2001, Citation2010) for mtDNA of some non-migratory galaxiid fish affected by the tectonic evolution discussed in this study. The scale bars shows the magnitude of relative genetic differences between the galaxiids in different river catchments and the approximate timing of separation of populations (after Craw et al. Citation2007a, Citation2008a). Numbers on trees refer to river capture events in .
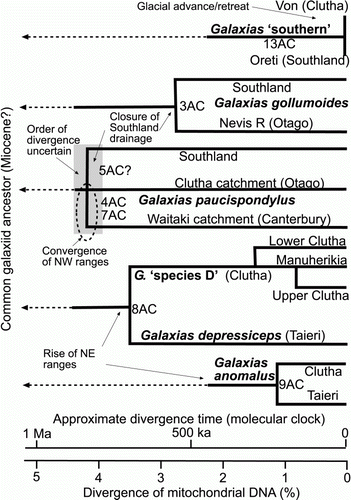
Figure 8  Summary evolutionary trees (after Burridge et al. Citation2006, Citation2007, Citation2008; Craw et al. Citation2007a, Citationb; Waters et al. Citation2001, Citation2010) for mtDNA of some non-migratory galaxiid fish affected by the tectonic evolution discussed in this study. The scale bars shows the magnitude of relative genetic differences between the galaxiids in different river catchments and the approximate timing of separation of populations (after Craw et al. Citation2007a, Citation2008a). Numbers on trees refer to river capture events in Table 1.

Figure 9 Generalised catchment maps of Otago and adjacent regions showing evolution of the extent of the Clutha catchment through the Quaternary. Ages are approximate. A, Early Quaternary (c. 1.5 Ma). B, Late Quaternary (c. 500 ka). C, Present day. The present main stem of the Clutha River and principal modern lakes are shown on all three maps for reference. A middle Quaternary catchment map, for the period between A and B, is shown with specific river courses in B.

Figure 9  Generalised catchment maps of Otago and adjacent regions showing evolution of the extent of the Clutha catchment through the Quaternary. Ages are approximate. A, Early Quaternary (c. 1.5 Ma). B, Late Quaternary (c. 500 ka). C, Present day. The present main stem of the Clutha River and principal modern lakes are shown on all three maps for reference. A middle Quaternary catchment map, for the period between A and B, is shown with specific river courses in Fig. 2B.

Reprints and Corporate Permissions

Please note: Selecting permissions does not provide access to the full text of the article, please see our help page How do I view content?

To request a reprint or corporate permissions for this article, please click on the relevant link below:

Academic Permissions

Please note: Selecting permissions does not provide access to the full text of the article, please see our help page How do I view content?

Obtain permissions instantly via Rightslink by clicking on the button below:

If you are unable to obtain permissions via Rightslink, please complete and submit this Permissions form. For more information, please visit our Permissions help page.