1,120
Views
4
CrossRef citations to date
0
Altmetric
Research articles

Application of Raman spectroscopy to distinguish adularia and sanidine in drill cuttings from the Ngatamariki Geothermal Field, New Zealand

, , , , , & show all
Pages 66-77 | Received 02 May 2014, Accepted 06 Nov 2014, Published online: 27 Jan 2015

Figures & data

Figure 1 Map showing the location of the Ngatamariki Geothermal Field (NGF), with wells Ngatamariki-5 (NM5) and Ngatamariki-6 (NM6) in the south of the field. The approximate near surface (c. 500 m) extent of the hydrothermal system is marked by the 10 and 20 ohm resistivity contours from Stagpoole et al. (Citation1985). Mapped faults are from Leonard et al. (Citation2010), and the Whakamaru caldera boundary is the approximate boundary as proposed by Wilson et al. (Citation1986).
Figure 2 Simplified stratigraphic column showing the subsurface stratigraphy encountered in wells NM5 and NM6. The stratigraphy reported by Ramirez & Rae (Citation2009) and Rae et al. (Citation2009) is simplified following the naming conventions of Gravley et al. (Citation2006), in which the Tahorakuri Formation and any locally named ignimbrites or interbedded lava bodies form the Reporoa Group. Age data have been modified after Leonard et al. (Citation2010).
Figure 3 Cross-polarised light photomicrographs and BSE image of potassium feldspars and alteration products. A, TVZ adularia from Ohakuri Dam (FB11-OD8a) used for reference; B, TVZ sanidine from the Whakamaru Group ignimbrites (SB-2028a) used as for reference; C, a typical potassium feldspar observed in the cuttings of NM5 with no obvious twinning; D, pseudomorphs of adularia with fine twinning associated with alteration products such as illite are sometimes observed in NM5; E, photomicrograph; and F, BSE image of a crystal (sample NM5-1600g) partially altered to adularia (medium grey in BSE image), albite (dark grey) and carbonate (light grey). The circles show the approximate region the EMP measurements were taken and analysis numbers correspond to those given in .
Figure 3 Cross-polarised light photomicrographs and BSE image of potassium feldspars and alteration products. A, TVZ adularia from Ohakuri Dam (FB11-OD8a) used for reference; B, TVZ sanidine from the Whakamaru Group ignimbrites (SB-2028a) used as for reference; C, a typical potassium feldspar observed in the cuttings of NM5 with no obvious twinning; D, pseudomorphs of adularia with fine twinning associated with alteration products such as illite are sometimes observed in NM5; E, photomicrograph; and F, BSE image of a crystal (sample NM5-1600g) partially altered to adularia (medium grey in BSE image), albite (dark grey) and carbonate (light grey). The circles show the approximate region the EMP measurements were taken and analysis numbers correspond to those given in Table 1.

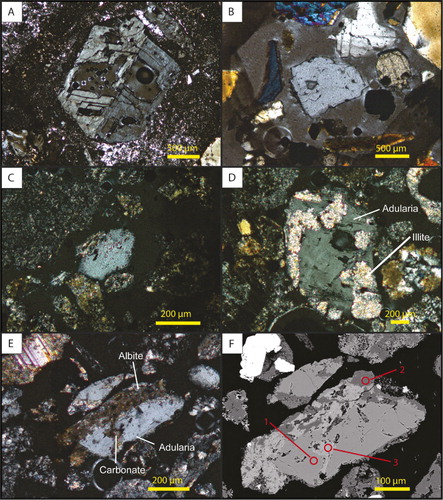
Table 1 Major element analysis for alteration products in NM5.

Figure 4 A, Representative spectra showing major peak positions for epoxy resin, TVZ adularia (FB11-OD8), TVZ sanidine (SB-2028), and quartz. B, Averaged Raman spectra for the TVZ adularia and sanidine showing major peak positions in the 100–620 cm−1 spectral region.

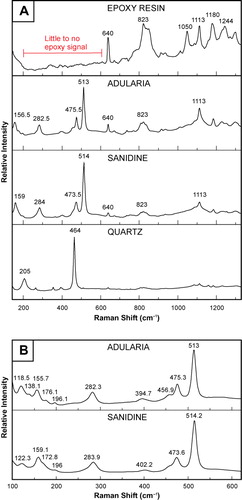
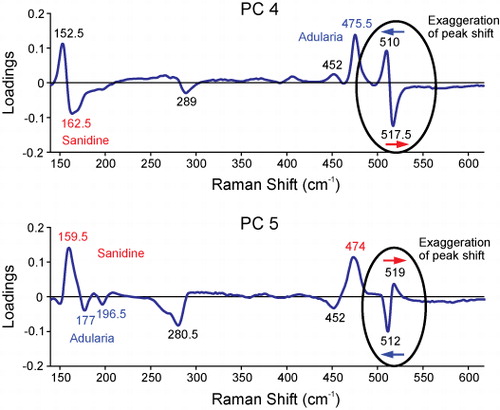
Table 2 Raman peak positions for samples outside the adularia field from PCA.

Figure 5 A, Scores plot showing all samples after PCA. The unknown samples from Ngatamariki-5 plotting in a field containing adularia and sanidine were analysed further, those outside this field all plot in the quartz field.B, Scores plot showing PC-4 against PC-5 for the feldspar samples are shown. Taupo Volcanic Zone adularia is shown in blue, and TVZ sanidine in red, with the unknown NM5 drill-cutting samples, shown in grey, plotting in and around the adularia field. The NM5 samples within the blue field are assumed to be adularia, whereas those samples outside this field were analysed further using peak position data.
Figure 6 Loadings plots of PC-4 and -5 are shown. Peaks associated with adularia spectral features are given in blue and those associated with sanidine are given in red.
Figure 7 Ternary plot showing compositions for all feldspars analysed in this study, as well as TVZ sanidine and adularia from the TVZ reported elsewhere. Inset shows the orthoclase end member in a larger scale. *Hedenquist & Browne (Citation1989); Brown (Citation1994).
Figure 7 Ternary plot showing compositions for all feldspars analysed in this study, as well as TVZ sanidine and adularia from the TVZ reported elsewhere. Inset shows the orthoclase end member in a larger scale. *Hedenquist & Browne (Citation1989); ‡Brown (Citation1994).

Table 3 Major element analysis for TVZ sanidine and adularia and representative NM5 samples.

Appendix Electron microprobe results

Reprints and Corporate Permissions

Please note: Selecting permissions does not provide access to the full text of the article, please see our help page How do I view content?

To request a reprint or corporate permissions for this article, please click on the relevant link below:

Academic Permissions

Please note: Selecting permissions does not provide access to the full text of the article, please see our help page How do I view content?

Obtain permissions instantly via Rightslink by clicking on the button below:

If you are unable to obtain permissions via Rightslink, please complete and submit this Permissions form. For more information, please visit our Permissions help page.