1,554
Views
21
CrossRef citations to date
0
Altmetric
Research articles

Pleistocene paleodrainage and placer gold redistribution, western Southland, New Zealand

, , &
Pages 137-153 | Received 07 Aug 2014, Accepted 10 Dec 2014, Published online: 20 Mar 2015

Figures & data

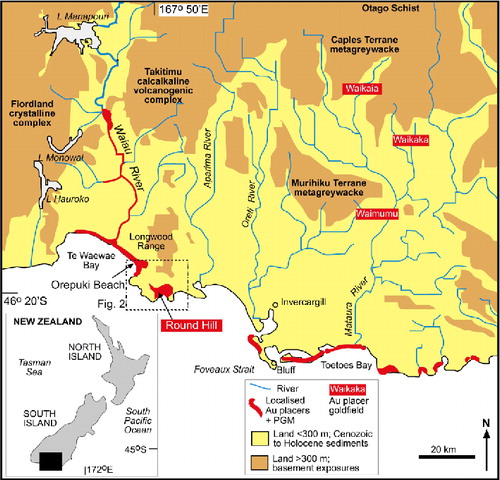
Figure 1 Location map for principal occurrences of placer gold in the southern South Island, showing the western gold (and PGM) transport pathway (this study) from Waiau River to Foveaux Strait, and the eastern gold transport pathway in the Mataura River catchment. Principal basement rock types relevant to this study are indicated.
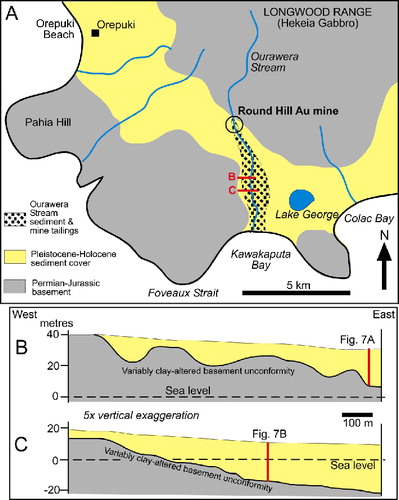
Figure 2 Geological sketch showing: A, the Orepuki Beach and Ourawera Stream areas; and B, C, cross sections of the sediments underneath Ourawera Stream based on drillhole data.

Table 1 Summary of principal constituents and properties of Pleistocene–Recent sediments relevant to placer gold in the Foveaux Strait area, western Southland.
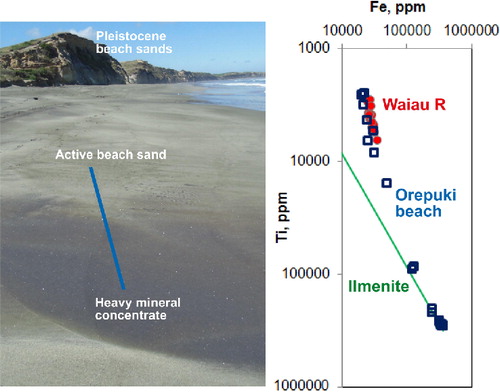
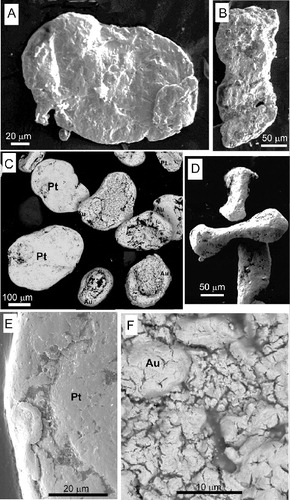
Figure 3 Photograph of part of Orepuki Beach, with a heavy mineral concentration veneer in the foreground, with Fe and Ti data (from handheld XRF) gathered along the indicated line. The green line on graph indicates the Fe/Ti ratio of ilmenite, culminating in pure ilmenite at the bottom of that line.
Figure 4 Scanning electron micrographs of detrital gold particles from Te Waewae Bay beaches. A, Rough flake; B, rough elongate particles are from the beach near the Waiau River mouth; C, particles from an Orepuki Beach heavy mineral concentrate, showing gold toroids with wind-peened margins and two isoferroplatinum flakes (Pt) for comparison; D, elongate gold particles with wind-peened ends from Orepuki Beach; E, close view of the incipiently wind-peened margin and smooth interior surface of an isoferroplatinum grain from Orepuki Beach; F, close view of the interior of a gold toroid from Orepuki Beach, showing irregular texture probably reflecting Au dissolution.
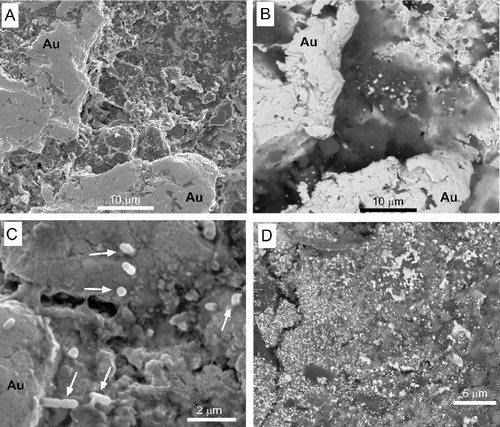
Figure 5 Scanning electron micrographs of the interior textures of toroidal detrital gold particles from Orepuki Beach. A, Surface topography; B, backscatter electron image of the same view, showing the structure of polymorphic encrustations that include biological and clay material; C, close view of the topography of polymorphic encrustation showing bacterial shapes (arrowed); D, backscatter electron image of fine-grained authigenic gold overgrowths (white), on and in polymorphic encrustation material.
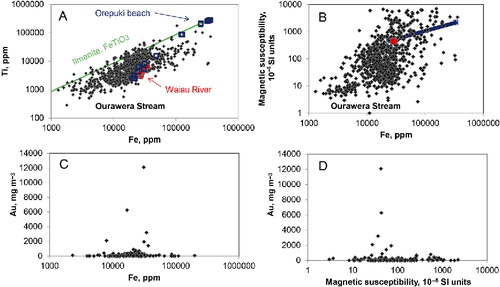
Figure 6 Field instrument characterisation and gold contents of sediments from drillholes in the Ourawera Stream sedimentary sequence (black diamonds) compared with Waiau River sands (circles) and the trend for Orepuki Beach sands (open squares; ). A, Fe vs Ti content, in relation to Fe/Ti ratio line (); B, Fe content vs magnetic susceptibility; C, Fe content vs gold content; D, magnetic susceptibility vs gold content.
Figure 6 Field instrument characterisation and gold contents of sediments from drillholes in the Ourawera Stream sedimentary sequence (black diamonds) compared with Waiau River sands (circles) and the trend for Orepuki Beach sands (open squares; Fig. 3). A, Fe vs Ti content, in relation to Fe/Ti ratio line (Fig. 3); B, Fe content vs magnetic susceptibility; C, Fe content vs gold content; D, magnetic susceptibility vs gold content.
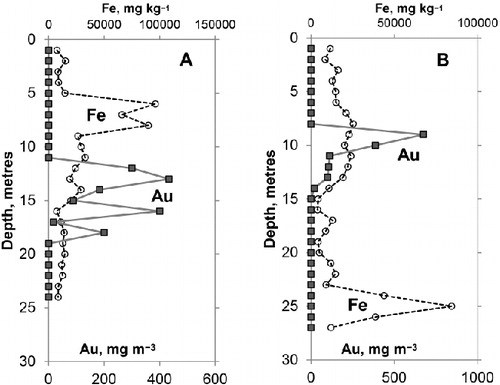
Figure 7 Sections down two drillholes in Ourawera Stream sediments (as indicated in ) showing Fe contents and gold contents of sampled medium and coarse sands.
Figure 7 Sections down two drillholes in Ourawera Stream sediments (as indicated in Fig. 2B–C) showing Fe contents and gold contents of sampled medium and coarse sands.
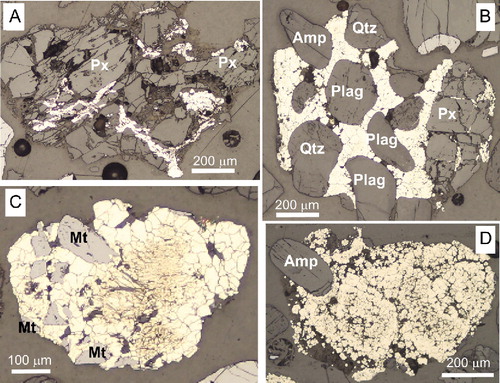
Figure 8 Incident light photomicrographs of textures of authigenic pyrite (white mineral) in an epoxy grain mount of Ourawera Stream sediment from below the limit of oxidation. A, Complexly shaped pyroxene clast (Px) has been partially pervaded by pyrite; B, pyrite has cemented clasts of quartz (Qtz), plagioclase (Plag) and amphibole (Amp), and penetrated along fractures in a pyroxene clast (right); C, massive pyrite has inclusions of numerous small magnetite (Mt) clasts; D, polyphase pyrite cement partially includes an amphibole clast.
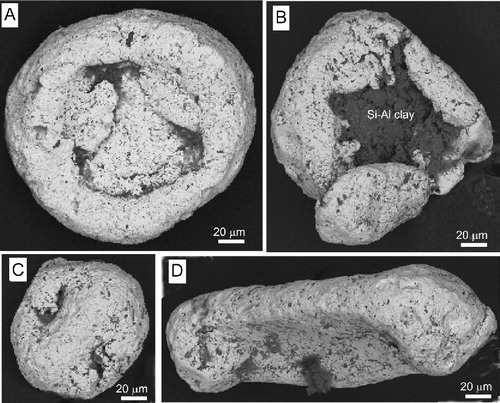
Figure 9 Scanning electron micrographs of gold particles from Ourawera Stream sediments, collected from drillhole samples. Dark patches in crevices are polymorphic encrustations that include Si–Al clay, probably kaolinite. A–C, Typical toroidal particles; D, rare rounded but equant particle.
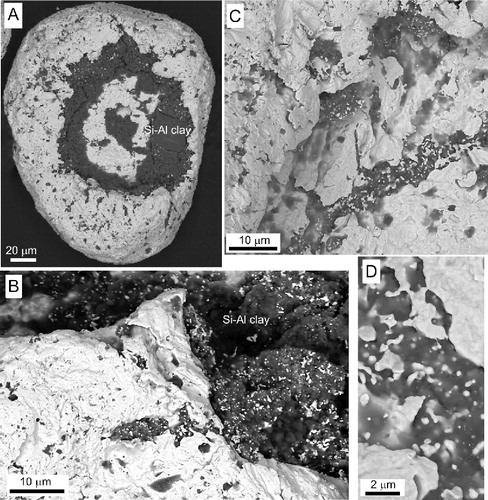
Figure 10 Backscatter scanning electron micrographs of Ourawera Stream gold, as in , but displaying authigenic gold overgrowths. A, B, Toroidal detrital particle with clay-rich polymorphic encrustation (dark) and microparticulate authigenic gold (white specks) overgrowing the polymorphic clay-rich encrustation; C, D, microparticulate gold and gold bud overgrowths on detrital gold toroid surface.
Figure 10 Backscatter scanning electron micrographs of Ourawera Stream gold, as in Fig. 8, but displaying authigenic gold overgrowths. A, B, Toroidal detrital particle with clay-rich polymorphic encrustation (dark) and microparticulate authigenic gold (white specks) overgrowing the polymorphic clay-rich encrustation; C, D, microparticulate gold and gold bud overgrowths on detrital gold toroid surface.
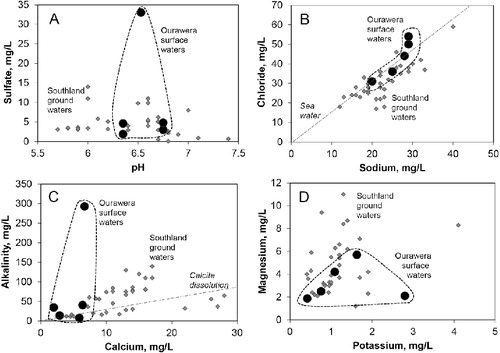
Figure 11 Surface water compositions in the lower Ourawera Stream catchment (black circles) compared with groundwater compositions (grey diamonds; from Durie Citation2001) in sediments in the Invercargill area of Southand (). A, Water pH and sulfate contents; B, sodium and chloride contents, in relation to seawater Na/Cl ratio (dashed line); C, calcium and alkalinity concentrations, compared to ratio expected from near-surface dissolution of calcite (dashed line); D, potassium and magnesium concentrations.
Figure 11 Surface water compositions in the lower Ourawera Stream catchment (black circles) compared with groundwater compositions (grey diamonds; from Durie Citation2001) in sediments in the Invercargill area of Southand (Fig. 1). A, Water pH and sulfate contents; B, sodium and chloride contents, in relation to seawater Na/Cl ratio (dashed line); C, calcium and alkalinity concentrations, compared to ratio expected from near-surface dissolution of calcite (dashed line); D, potassium and magnesium concentrations.
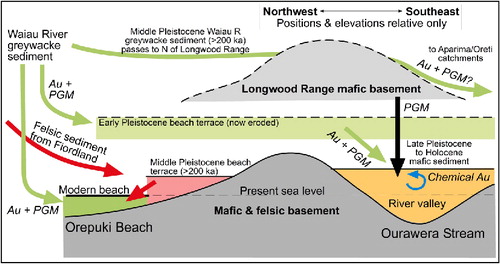
Figure 12 Summary cartoon of inferred sediment, gold and PGM sources and recycling in the vicinity of the Round Hill placer gold mine (). Green arrows and sediments are predominantly Waiau River greywacke detritus; red arrows and sediments are Fiordland-derived; orange sediments are locally derived. See text for explanation.
Figure 12 Summary cartoon of inferred sediment, gold and PGM sources and recycling in the vicinity of the Round Hill placer gold mine (Fig. 2). Green arrows and sediments are predominantly Waiau River greywacke detritus; red arrows and sediments are Fiordland-derived; orange sediments are locally derived. See text for explanation.
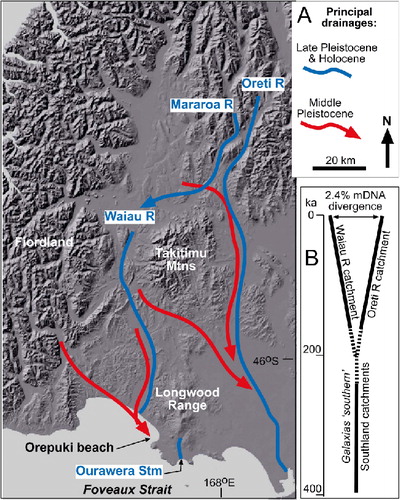
Figure 13 A, Map showing inferred regional paleodrainage variations that have led to the sediment provenance differences summarised in ; B, genetic divergence of freshwater-limited fish in the adjacent Oreti and Waiau River catchments, showing the genetic isolation of the Waiau catchment fish since 200 ka (after Burridge et al. Citation2007; Craw et al. Citation2007).
Figure 13 A, Map showing inferred regional paleodrainage variations that have led to the sediment provenance differences summarised in Fig. 10; B, genetic divergence of freshwater-limited fish in the adjacent Oreti and Waiau River catchments, showing the genetic isolation of the Waiau catchment fish since 200 ka (after Burridge et al. Citation2007; Craw et al. Citation2007).

Reprints and Corporate Permissions

Please note: Selecting permissions does not provide access to the full text of the article, please see our help page How do I view content?

To request a reprint or corporate permissions for this article, please click on the relevant link below:

Academic Permissions

Please note: Selecting permissions does not provide access to the full text of the article, please see our help page How do I view content?

Obtain permissions instantly via Rightslink by clicking on the button below:

If you are unable to obtain permissions via Rightslink, please complete and submit this Permissions form. For more information, please visit our Permissions help page.