Figures & data
![Figure 1 A, Map of New Zealand North and South islands showing distribution of litho-stratigraphic tectonic terranes of the Eastern Province. Data compiled from Coombs et al. (Citation1976), Frost & Coombs (Citation1989), Mortimer et al. (Citation1997), Mortimer et al. (Citation1999), Wandres et al. (Citation2004), Adams et al. (Citation2005), Adams et al. (Citation2009) and Leonard et al. (Citation2010); B, Map of part of North Island showing location of samples described in this paper (see Table 1). TVZ indicates the outline of the Taupo Volcanic Zone (Rowland & Sibson Citation2001). CVZ is the Coromandel Volcanic Zone (Briggs et al. Citation2005) and NA the Northland Arc (Hayward et al. Citation2001); C, Schematic cross-section showing relationship between central North Island composite terranes and the TVZ. The dip inferred for the terrane boundaries in central North Island is based on the occurrence of a metamorphosed Pahau xenolith in a young (28 ka) dacite dome from northeast of Taupo (Charlier et al. Citation2010), which indicates the presence of Pahau at depth to the west of the eastern surface boundary of the Waipapa Terrane.](/cms/asset/58fcd44e-5053-4c65-9517-f677ca6e4e9d/tnzg_a_1026832_f0001_c.jpg)
Table 1 North Island Torlesse and Waipapa terrane sample locality and stratigraphic and petrographic summary. Grain sizes (to nearest 50 µm) and other petrographic data are from visual examination of unstained thin-sections.
![Figure 2 Variation in abundance of selected major elements (Al2O3, MgO and iron as total Fe2O3) and K2O/Na2O ratio relative to SiO2 content. All data are normalised to 100% on a volatile free basis. Ss: sandstone; Ms: mudstone. Fields for Waipapa (W) and Torlesse (T) are from the GNS Science PETLAB database. And: average primitive andesite composition from Keleman et al. (Citation2005). L: average Longwood crust representing Median Batholith intra-oceanic arc crust (Price et al. Citation2011). GL: average global subducting sediment (GLOSS) of Plank & Langmuir (Citation1998). Gr: average composition of Lachlan Fold Belt granites from Chappell & White (Citation1992). UC: estimated upper crustal composition of Rudnick & Gao (Citation2005). Fields shown in D (broken lines) are from Roser & Korsch (Citation1986). PM: passive margin. ACM: active continental margin; ARC: oceanic island arc margin. Broken lines with arrows show mixing trajectories from average granite towards stoichiometric clay, muscovite (Mu) and chlorite (Chl) compositions.](/cms/asset/62807c9d-2820-4f80-97e8-7b6e11bbd4fe/tnzg_a_1026832_f0002_b.jpg)
![Figure 3 Variation in abundance of selected trace elements relative to SiO2 content. Acronyms as for Fig. 2.](/cms/asset/1d0a41b7-ed8e-42b7-9d4f-e368ed12ef6e/tnzg_a_1026832_f0003_b.jpg)
Table 2 Major and trace element and isotope analyses for Kaweka and Pahau terrane samples. Samples P54704–P54721 are Kaweka and samples P73609–P73599 Pahau. Data shown in italics were obtained by LA-ICP-MS. All other analyses are XRF data. Precision and accuracy for major and trace elements and isotopes are discussed in the text. Gaps in the trace element data indicate that either the element was not analysed or that concentration is below the detection limit. Lithologies are summarised in .
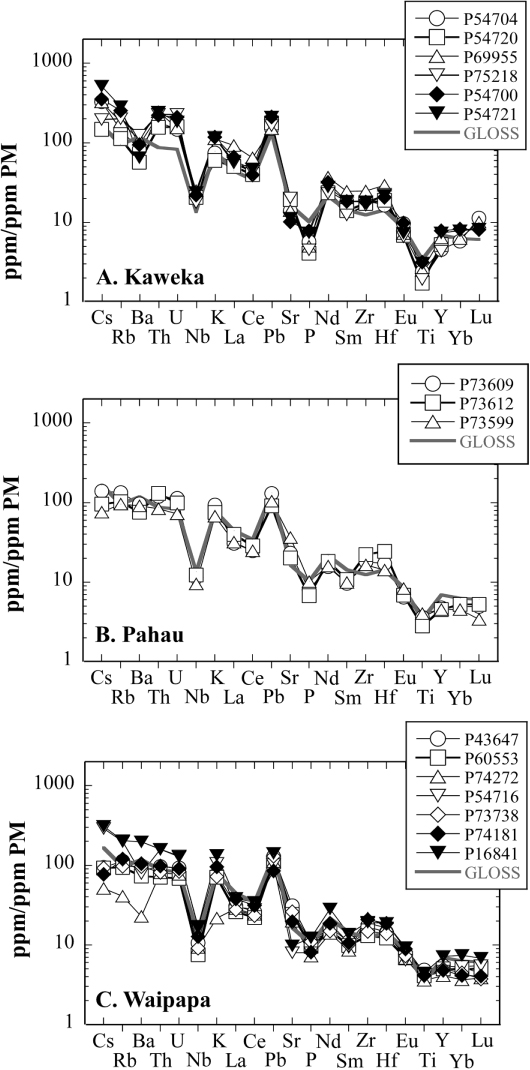
![Figure 4 Chondrite-normalised rare earth element patterns for: A, Kaweka; B, Pahau; and C, Waipapa Terrane sandstones and mudstones. These are in each case compared with GLOSS, average global subducting sediment (Plank & Langmuir Citation1998). Chondritic values are from McDonough & Sun (Citation1995). Filled symbols are mudstones.](/cms/asset/58e1570f-4b75-4a51-8ceb-eb621fe0ebbf/tnzg_a_1026832_f0004_b.jpg)
![Figure 5 Primitive mantle-normalised extended element patterns for: A, Kaweka; B, Pahau; and C, Waipapa Terrane sandstones and mudstones. These are in each case compared with GLOSS, average global subducting sediment (Plank & Langmuir Citation1998). Primitive mantle values are from McDonough & Sun (Citation1995). Filled symbols are mudstones.](/cms/asset/de4b410d-b7ad-42ce-9f2d-539c9d4ed84a/tnzg_a_1026832_f0005_b.jpg)
![Figure 6 A, Variation in present-day Sr and Nd isotope composition for North Island greywacke samples; B, 143Nd/144Nd versus Th/Sc for North Island greywacke samples and comparisons with andesite, global subducting sediment and eastern Australian granite averages. Old, upper continental crust has low 143Nd/144Nd and Th/Sc ratios of approximately 1, whereas modern primitive arcs have higher 143Nd/144Nd and Th/Sc ratios <1 (Taylor & McLennan Citation1985; McLennan et al. Citation1993). K: Kermadec arc; TVZ: Taupo Volcanic Zone (data from Ewart & Hawkesworth Citation1987; Sutton et al. Citation1995; Gamble et al. Citation1996; Smith et al. Citation2010; Price et al. Citation2012). Fields for Waipapa (W) and Torlesse (T) include data from McCulloch et al. (Citation1994), Wandres et al. (Citation2004) and Adams et al. (Citation2005). MB: field for Median Batholith (data from Mortimer et al. Citation1997; Muir et al. Citation1998; Mortimer et al. Citation1999; Price et al. Citation2006). And: average primitive andesite composition from Keleman et al. (Citation2005). L: average Longwood Complex from Southland representing Median Batholith intra-oceanic arc crust (Mortimer et al. Citation1999; Price et al. Citation2006). GL: average global subducting sediment (GLOSS) of Plank & Langmuir (Citation1998). UC: estimated isotopic composition of upper crust exposed to weathering (Goldstein & Jacobsen Citation1988). LFB: the average composition of Lachlan Fold Belt granites (data from McCulloch & Chappell Citation1982; Eberz et al. Citation1990; McCulloch & Woodhead Citation1993; Elburg Citation1996; Maas et al. Citation1997; Soesoo Citation2000; Waight et al. Citation2000, Citation2001; Collins et al. Citation2006). NEFB: average of New England Fold Belt granites from Hensel et al. (Citation1985). Where required, published Nd isotopic data were re-normalised to 146Nd/144Nd = 0.7219 and adjusted to be consistent with modern CHUR = 0.512638. Curves (solid, dashed) depict schematic mixing trends.](/cms/asset/f326a07f-21c5-4079-b305-91d5d410f370/tnzg_a_1026832_f0006_b.jpg)
![Figure 7 Variation in present-day Pb isotope composition for North Island greywacke samples. Fields for Waipapa (W) and Torlesse (T) include data from Graham et al. (Citation1992) and McCulloch et al. (Citation1994). K: Kermadec arc and TVZ: Taupo Volcanic Zone (data from Ewart & Hawkesworth Citation1987; Graham et al. Citation1992; Gamble et al. Citation1996; Smith et al. Citation2010; Price et al. Citation2012). MB: field for Median Batholith (unpublished data of A. Tulloch). And: average primitive andesite composition from Keleman et al. (Citation2005). GL: average global subducting sediment (GLOSS) of Plank & Langmuir (Citation1998). LFB: average composition of Lachlan Fold Belt granites (recalculated from feldspar Pb isotope data of McCulloch & Woodhead Citation1993). UC: estimate of upper crustal Pb isotope composition from Zartman & Doe (Citation1981). Solid lines between the And, LFB and UC model components depict schematic mixing lines which are straight lines in Pb–Pb isotope space.](/cms/asset/4d0840bb-02ee-4560-bf31-69d77a6bbb43/tnzg_a_1026832_f0007_b.jpg)