Figures & data
Figure 1 Present-day location and tectonic setting of Pegasus Basin, major bathymetric features and the locations of some other sedimentary basins of Zealandia. The direction and rate of Pacific plate convergence relative to a fixed Australian plate are shown by the large white arrows. Inset: Free-air (offshore) and crustal Bouguer gravity anomalies (onshore), eastern Zealandia. Pegasus Basin is well-defined by a regional gravity low.
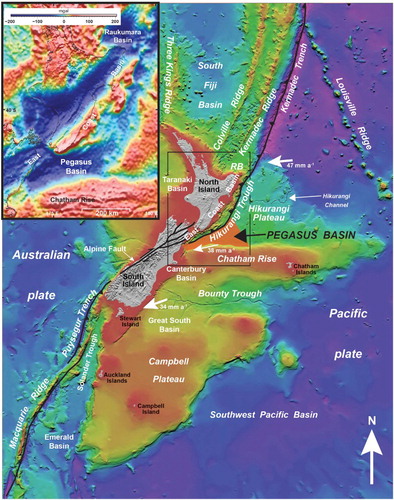
Figure 2 Reconstructions of the New Zealand region from the Early Cretaceous to early Neogene (adapted from Stagpoole et al. Citation2008). Simplified paleo-positions of Pegasus Basin and adjacent sedimentary basins are shown. The grey dashed polygon represents the approximate shape and position of the Hikurangi Plateau (excluding parts subducted beneath the Chatham Rise; after Reyners Citation2013). A, Subduction along the Gondwana margin. B, Separation of Zealandia from Gondwana, Tasman Sea formation and thermal subsidence and sedimentation along eastern sedimentary basins. C, Continued thermal subsidence and sedimentation across Pegasus Basin, rifting in southern Zealandia and compression in the northwest. D, Propagation of the Hikurangi subduction system beneath eastern New Zealand. Onset of deformation in the East Coast Basin, and relative tectonic quiescence in Pegasus Basin.
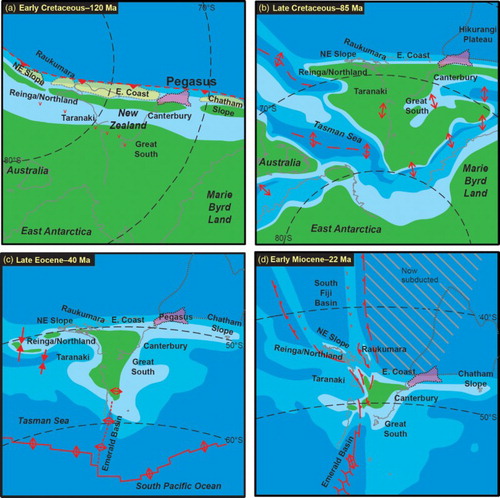
Figure 3 Bathymetry of the Pegasus Basin region and locations of seismic surveys and petroleum exploration drillholes. The locations of other figures in this article are also indicated.
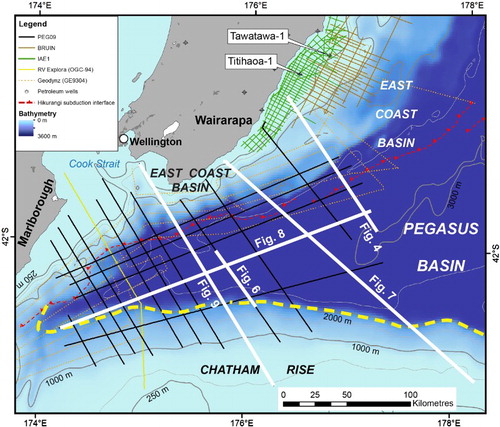
Figure 4 Seismic line PEG09-25, showing the transition from little-deformed strata in Pegasus Basin to folded and faulted rocks within the East Coast Basin. The most seaward fold is taken to represent the location of the present-day subduction interface east of North Island and the western boundary of Pegasus Basin. E, base Eocene; H, top Hikurangi Plateau; M, base Miocene; O, base Oligocene; P, base Paleocene; PP, base Pliocene–Pleistocene; SB, seabed; T, top Torlesse basement.
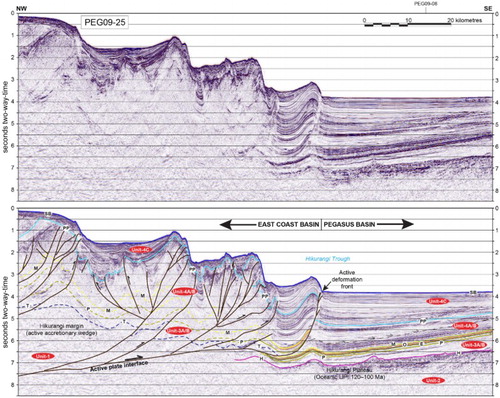
Figure 5 Simplified chronostratigraphic panels for the Wairarapa, Marlborough, Chatham Islands and Hikurangi Plateau areas. These regions surround Pegasus Basin and provide some stratigraphic analogues for the stratigraphy likely to occur in the basin. After Uruski & Bland (Citation2011).
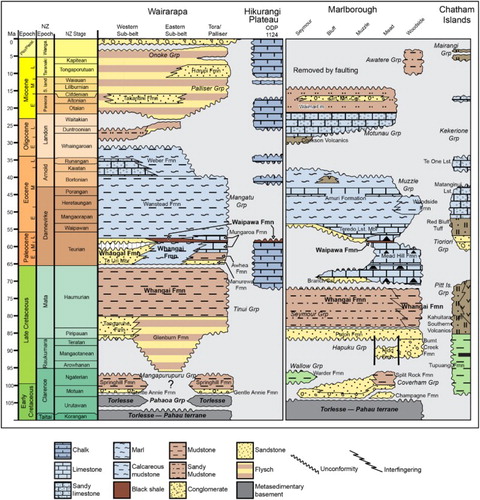
Figure 6 Part of seismic line PEG09-021 showing the typical seismic character of Units 1 and 3A of the Torlesse Composite Terrane, which represent basement strata in Pegasus Basin. Strata labelled ‘Unit-1’ are structurally complex metasedimentary basement rocks of the Torlesse Composite Terrane, and possibly of Jurassic–Early Cretaceous age; ‘Unit-2’ is the Hikurangi Plateau; ‘Unit-3A’ is interpreted as faulted and folded Early Cretaceous sediments frozen in the process of subduction accretion. They have characteristics of ‘Unit-1’ and ‘Unit-3B’, the latter comprising relatively undeformed Early Cretaceous sedimentary rocks that never reached the Gondwana subduction margin. ‘Unit-4A’ comprises sedimentary rocks of Early Miocene age, ‘Unit-4B’ comprises sedimentary rocks of inferred Middle–Late Miocene age, and ‘Unit-4C’ comprises sedimentary rocks of Pliocene–Pleistocene age. Abbreviations as for Fig. 4.
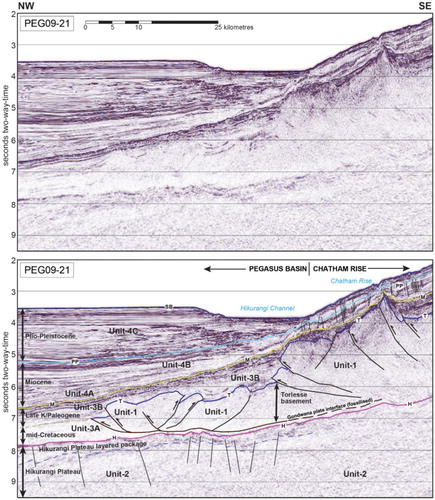
Figure 7 Northwest–southeast seismic cross-section of Pegasus Basin from the Cook Strait area to the crest of the Chatham Rise (line SAHKE-01), illustrating the major tectonostratigraphic elements. This profile images two ‘opposing’ subduction systems: the modern Hikurangi margin (left) and the ancient Gondwana margin (right), with the latter ‘frozen’ in the process of subduction accretion. The modern subduction interface is clearly visible; the most-seaward fold of the East Coast Basin is taken to represent the subduction interface and the boundary with the adjacent Pegasus Basin. Also evident is the little-deformed character of Pegasus Basin, compared with the more deformed East Coast Basin. The asymmetrical Neogene succession in Pegasus Basin is prominent in this cross-section. Abbreviations as for Fig. 4.
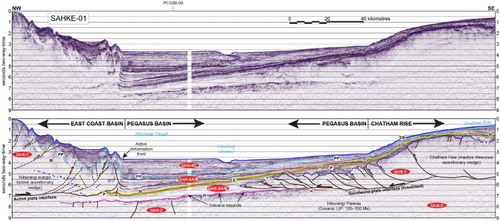
Figure 8 WSW–ENE seismic dip-profile broadly along the axis of Pegasus Basin from the Chatham Rise (line PEG09-08). The ancient Gondwana margin is prominent. The Hikurangi Channel, a prominent present-day seafloor feature, is evident on this line. Abbreviations as for Fig. 4.
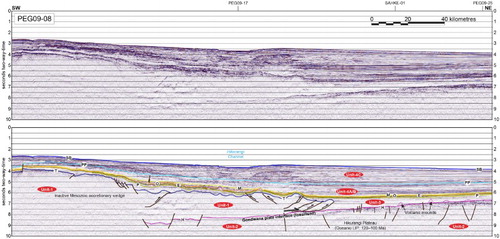
Figure 9 Northwest–southeast seismic cross-section of Pegasus Basin from the Cook Strait area to the crest of the Chatham Rise (line PEG09-17), illustrating the major tectonostratigraphic elements of this part of eastern New Zealand. This profile images two ‘opposing’ subduction systems, the modern Hikurangi margin (left) and the ancient Gondwana margin (right) with the latter ‘frozen’ in the process of subduction accretion. The modern subduction interface is clearly visible, and defines the most-seaward fold of the East Coast Basin which separates this basin from the adjacent Pegasus Basin. Also evident is the little-deformed character of Pegasus Basin, compared with the more-deformed East Coast Basin. The asymmetrical Neogene succession in Pegasus Basin is prominent in this cross-section and reflects the downwarping of underlying basement associated with the Neogene Hikurangi subduction system. Note also the widespread bottom-simulating-reflector in upper parts of the profile, which is interpreted to represent the gas hydrate stability zone. Adapted from Bland et al. (Citation2014a, b).
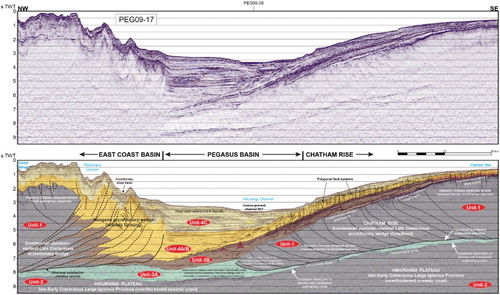
Figure 10 Depth maps (metres below sea level) to the top-Hikurangi Plateau and the base of Units 3B, 4A and 4C within Pegasus Basin. The extent of these maps is constrained by the PEG09 seismic survey; Pegasus Basin probably continues east of the area depicted here. Adapted from Bland et al. (Citation2012, Citation2014b).
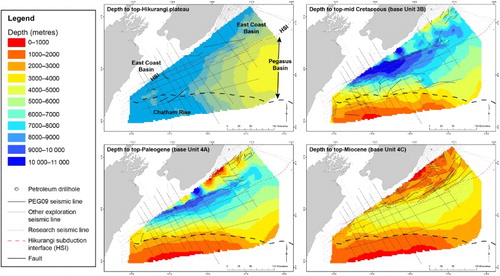
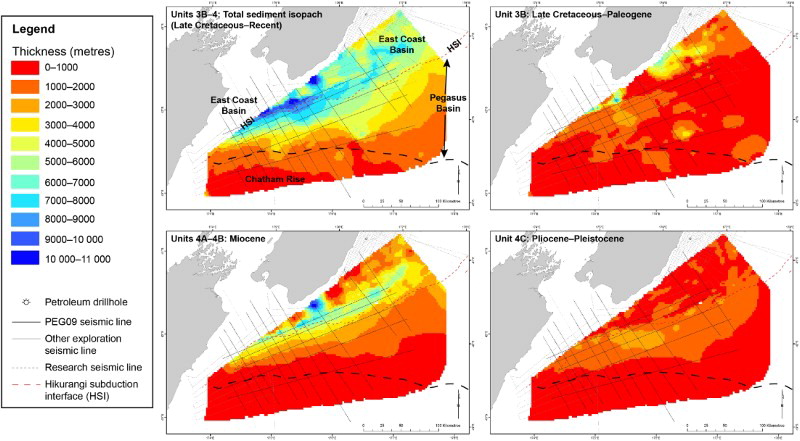
Figure 11 Isopach maps (metres) of total sediment thickness (Late Cretaceous–Recent) and Units 3B to 4C within Pegasus Basin. The apparent increases in stratigraphic thickness west of the Hikurangi subduction interface are probably due, at least in part, to structural repetition within the accretionary margin. The extent of these maps is constrained by the PEG09 seismic survey; Pegasus Basin probably continues east of the area depicted here. Adapted from Bland et al. (Citation2012a, Citation2014b).