
Figures & data
Figure 1. A, Late Quaternary faults of central New Zealand (modified from Litchfield et al. Citation2013; Ghisetti et al. Citation2014). The white arrow shows the relative plate motion vector between the Pacific and Australian plates (Beavan & Haines Citation2001; Wallace et al. Citation2007). CF, Cape Farewell; CFF, Cape Foulwind Fault; ChCh, Christchurch; H, Hokitika; KF, Kahurangi Fault; N, Nelson; W, Westport; Wn, Wellington. B, Historical seismicity for the period 1990–2014 (New Zealand earthquake catalogue, GeoNet). Focal mechanisms for large-magnitude pre-1990 earthquakes from Anderson et al. (Citation1993) and Doser et al. (Citation1999). KR, Kahurangi Range; PR, Paparoa Range; SA, Southern Alps. Onshore faults are earthquake sources recognised in the current National Seismic Hazard Model (Stirling et al. Citation2012). 1, Lower Buller; 2, Inangahua–Maimai; 3, Lyell; 4, White Creek. Bold black arrows indicate azimuth of maximum compressive stress σ1 across northern South Island (Sibson et al. Citation2012; Townend et al. Citation2012).
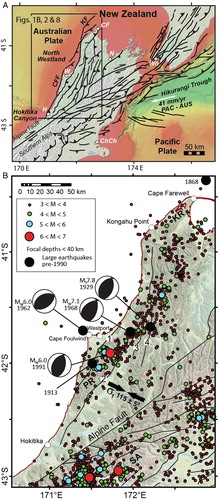
Table 1. Previous interpretations of late Quaternary tectonic activity and earthquake potential associated with the Cape Foulwind, Kahurangi and/or Kongahu faults.
Figure 2. A, Pliocene–Quaternary faults of North Westland, lying west of the Alpine Fault (modified from Ghisetti et al. Citation2014). Reverse faults in red are compressionally reactivated normal faults. No evidence of reactivation exists for the reverse faults in black. Offshore faults in bold red belong to the North Westland deformation front. Fault names are: 1, Kongahu–Lower Buller–Canoe; 2, Inangahua–Maimai; 3, Lyell; 4, White Creek; 5, Maunga; 6, Matiri–Matakitaki; 7, Tainui; 8, Tutaki; 9, Hohonu; 10, Karamea; 11, Anatoki; 12, Pikikiruna; 13, Wakamarama. Bathymetric contours (m bsl) are from the NIWA bathymetric database (www.bathymetry.co.nz), with the contour interval at 50 m on the slope beyond 200 m water depth, and 10 m inside 200 m water depth. Green dashed lines define sedimentary systems of the last sea-level cycle (HST, highstand systems tract; TST, transgressive systems tract; LST, lowstand systems tract). B, Geological cross-section (modified from section T11 in Ghisetti et al. Citation2014); fault colours as in part A. Bst, undifferentiated metamorphic and igneous basement; C–P, Cretaceous–Paleocene units; E–O, Eocene–Oligocene units; M–Q, Miocene–Quaternary units.
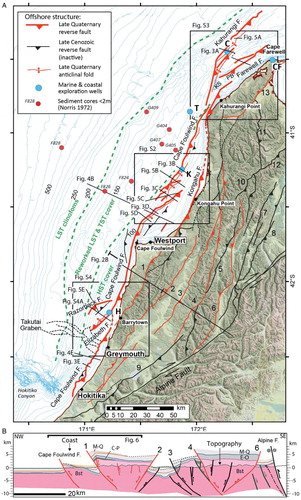
Figure 3. Interpretations of parts of processed seismic sections (TWT) available from http://www.nzpam.govt.nz. A, Composite seismic reflection section CK-81-1A-1B–FS8 across the Kahurangi and Farewell faults. Late Cenozoic reverse reactivation of the Kahurangi Fault is clearly documented by the harpoon-folding of syn-rift Late Cretaceous and Paleogene units in the fault hanging wall, associated with closure of normal separation of the top basement. Stratigraphy tied to Cook-1, Toropuihi-1 and Kongahu-1 (, S1) wells; dashed where inferred. B, C and D, lines CK81-20, CK81-25 and CK81-28, respectively, processed by Cultus Pacific (Citation1981); E, line PO59-08 from GECO NZ (1984). Borehole data at Kongahu-1 (Wiltshire Citation1984) have been tied to an available depth-converted section of this profile (Cultus Pacific Citation1981).
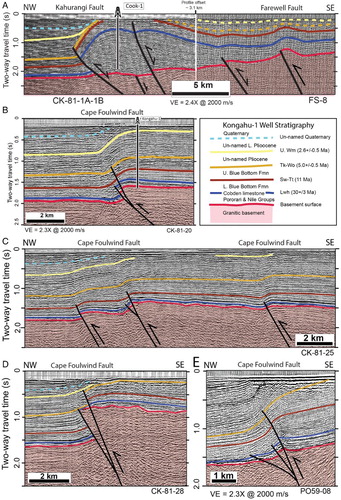
Figure 4. Interpretation of the geometry of late Quaternary sedimentary sequences above the Cape Foulwind Fault (CFF). A, Major glacio-eustatic sea-level cycles since 140 ka (e.g. Pillans et al. Citation1998) correlated to marine oxygen isotope stages (MIS) (Imbrie et al. Citation1984). TRS2/1 and TRS6/5 are the last two shelf-wide marine transgressive surfaces. B, Line drawing interpretation of boomer seismic data, modified from Van der Linden and Norris (Citation1974) (section location on A). LST: prograding clinoforms of the lowstand systems tract (MIS2, MIS6); TST: transgressive systems tract; HST: highstand systems tract. Sediment cores (Norris Citation1972) are shown as red bars with labels; samples G409, F824, G407 and G405 are projected approximately alongstrike onto the section (see locations on A). C, Enlargement of buried geomorphic scarp associated with the fault-related monocline above the Cape Foulwind Fault, showing the footwall and hanging-wall surface projections used to estimate scarp vertical relief on profiles. Along this section the scarp is close to the approximate location of the last glacial maximum (LGM) shoreline; its height may therefore have been influenced by erosion. D, seismic data reported by Stevenson (Citation2008; modified from his figure 21) from offshore of Greymouth. TRS: transgressive surfaces. The location of the section is approximately equivalent to the box in part E. E, Our interpretation of late Quaternary sedimentary sequences in a line drawing of sparker seismic profile MR2017-44B by Alpine Geophysical Associates (Citation1968). The location of the blind Cape Foulwind Fault is from multichannel seismic data.
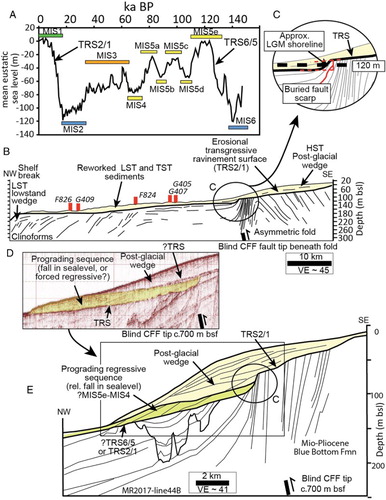
Figure 5. 3.5 kHz profiles recorded across the North Westland deformation front. A, Kahurangi Fault and associated anticline. B, C and D, Cape Foulwind Fault and associated monocline north of Westport. E, Razorback Fault and associated monocline off Barrytown. All data were acquired on RV Tangaroa voyage Tan1311 (see for profile locations). HST, highstand systems tract; TST, transgressive systems tract; TRS2/1, post-last glacial (<20 ka) transgressive surface.
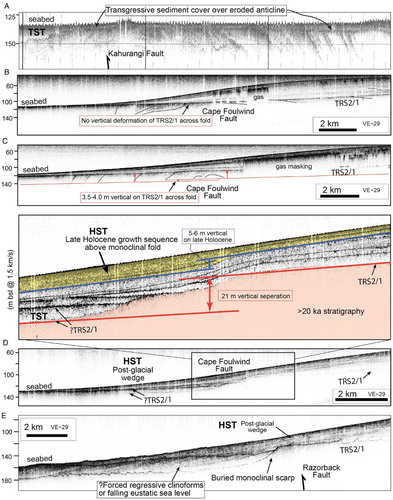
Figure 6. A, Coastal part of the geological section in B, across the Cape Foulwind (CFF) and Lower Buller (1) faults. No vertical exaggeration. B, C and D, three restoration stages for the section, involving progressive removal of fault separation and folding by trishear mechanisms (Erslev Citation1991), followed by decompaction. Restoration performed with Move software (Midland Valley). Note that compressional inversion of SE-dipping normal faults started in the Miocene and continues to present day.
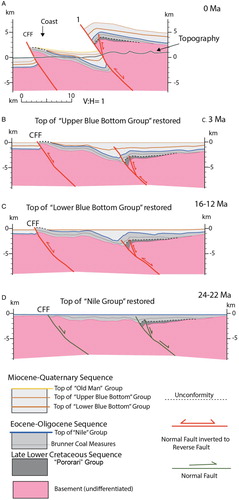
Figure 7. Vertical separation and vertical separation rates along the Cape Foulwind Fault. A, Footwall (fw) and hanging wall (hw) positions of top Basement (Bst); Lower Blue Bottom Formation (middle Miocene) (LBB); and Upper Blue Bottom Formation (Late Miocene) (UBB) as measured on the seven transects shown in part B. B, Location map of transects used for measurements of fault separation. C, Footwall and hanging-wall positions of late Quaternary erosion surfaces imaged in shallow-penetration sub-bottom profiles. Note that postglacial deformation (13–20 ka) on the northern segment of the fault is only confirmed on one sub-bottom profile (C). D, Maximum vertical separation rates on the Cape Foulwind Fault derived from the data in (C) under the assumption of three different age scenarios. See text for explanation. The smoothed grey line labelled 5pt M.A is a five-point moving average of the measurements for the 13–20 ka surface age scenario. In comparison, the horizontal green bar (labelled 1) is the separation rate determined on a late Pliocene (Mangapanian, Wm) surface interpreted in seismic data and tied to Kongahu-1 well. Comparative uplift rate data from coastal terrace sequences on the hanging wall of the Cape Foulwind Fault are defined as: 2, solid red boxes, 240–400 ka terraces of Suggate (Citation1992); 3, solid red boxes, 400–600 ka terraces of Suggate (Citation1992); 4, purple boxes, 120 ka terraces of Suggate (Citation1992); 5, yellow filled boxes, 6 ka beach terrace (Nine Mile Formation surface), (Rose, Citation2011); 6, open red box, 33–130 ka terraces (Craigs to Candlelight surfaces) of Rose (Citation2011); 7, filled green box, c. 66–123 ka terraces, Suggate (Citation1992) surfaces correlated southwards to the Greymouth–Point Elizabeth sequence by Nathan et al. (Citation2002) but plotted here using the younger dating model of Rose (Citation2011).
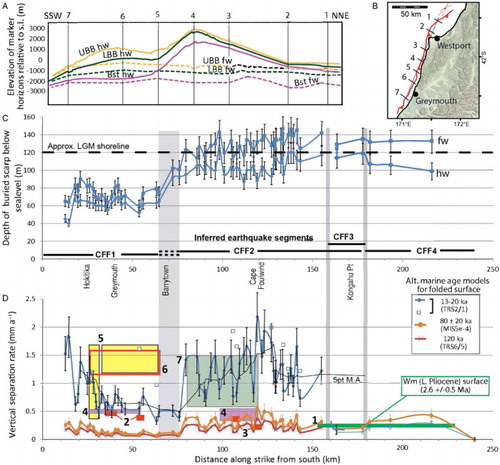
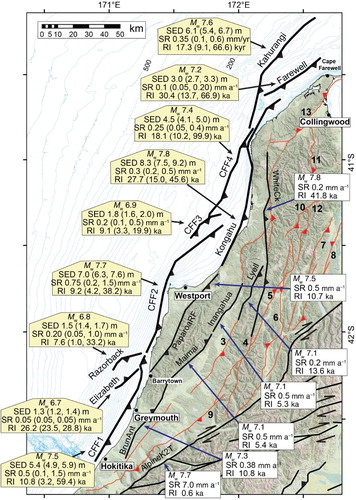
Figure 8. Interpretation of earthquake fault sources along the North Westland deformation front. Bold black lines are individual earthquake fault sources interpreted from the structures shown in , S2–S4, and from displacement data and slip-rate estimates (see for vertical separation data for the Cape Foulwind Fault segments CFF1–CFF3, and Table S2 for slip-rate estimates and other earthquake source parameters). Mw, moment magnitude; RI, recurrence interval; SED, coseismic single-event displacement; SR, slip rate. Bracketed values are minimum and maximum estimates. All calculations use the same New Zealand empirical relationships of Stirling et al. (Citation2012). Black fault lines onshore are earthquake fault sources, with associated parameters from the current National Seismic Hazard Model of Stirling et al. (Citation2012). Only the best estimates for Mw, SR and RI are indicated here for North Westland faults; however, uncertainties are shown in Table S2. Faults shown in red are late Cenozoic structures (Ghisetti et al. Citation2014), with no demonstrable activity in the last 125 ka from available data. Onshore faults labelled 1 to 10 are identified in .