Figures & data
Figure 1. Map of New Zealand highlighting the active faults presented in the NZAFD250 view (red). Locations of photo images in are identified with white stars. The map highlights three areas that are discussed in more detail in and .
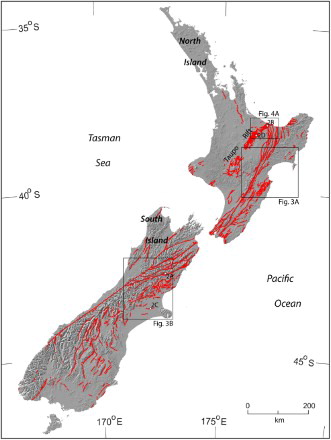
Table 1. Summary of GIS attributes developed for the NZAFD250; refer to Langridge et al. (Citation2014a) for detailed definitions. The five fault parameter attributes displayed in the online version are shaded.
Figure 2. Oblique aerial photograph examples of active faults in New Zealand; traces highlighted by arrows. A, The Hanmer Fault in north Canterbury at the foot of the Hanmer Range. B, The 1987 surface rupture trace of the Edgecumbe Fault, Bay of Plenty. C, The 2010 surface rupture trace of the Greendale Fault, Canterbury. D, Closely spaced normal faults in the northern part of the Taupo Rift (Photographs: A, B, D: DL Homer, GNS Science; C: R Jongens, GNS Science).
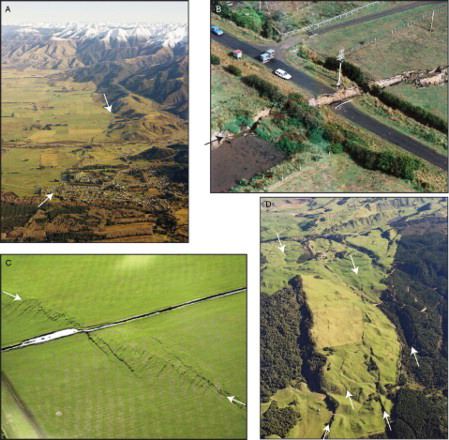
Figure 3. Examples of how to view the NZAFD250 data using a GIS or online. A, Selection of faults by style (DOM_SLIPTYPE) in the Hawke's Bay region (within white line). B, Selection of faults that have produced surface rupture (LAST_EVENT) in the historical period (red) among active faults of the central South Island (black). Locations of photo images in are identified with white stars.
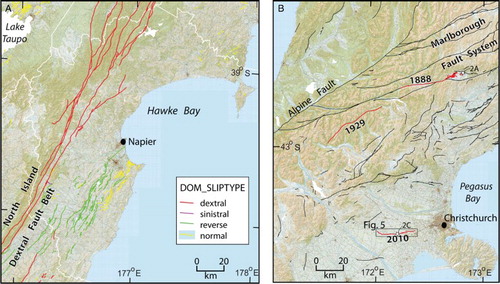
Figure 4. Examples of mapping closely spaced faults in the Bay of Plenty region in the NZAFD250. A, Faults in the North Island Shear Belt are broadly spaced compared to the Taupo Rift. B, Faults to the southwest of Lake Tarawera (inset) are very closely spaced but were able to be mapped at a detail that is consistent with a scale of 1:250,000. Locations of photo images in are identified by white stars.
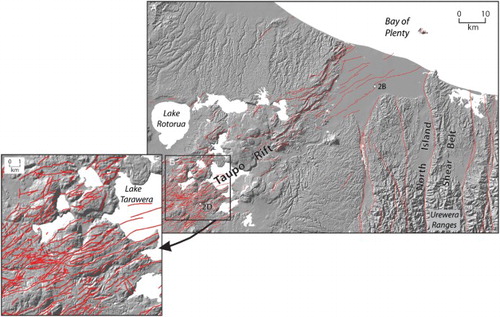
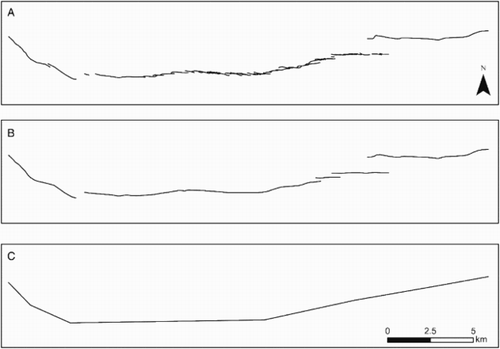
Figure 5. Using the Greendale Fault, Canterbury to highlight different views of active fault data sources. A, A view from field observations and LiDAR mapping at a scale of c. 1:5000. B, A simplified view for use at 1:250,000. C, A further simplified view for modelling purposes.