Figures & data
Figure 1. Regional setting. A, The position of ‘Eua and Nomuka on the Tonga Ridge and Vatoa and Ono-i-Lau on the Lau Ridge. The Tonga frontal arc basin sediments (shaded) are broadly coincident with the 2000 m isobath, after Tappin (Citation1993). B, The Tonga Ridge platform, highlighted by the 1000 m isobath, with the currently active back-arc Tofua volcanic chain. Block margins after Scholl & Vallier (Citation1985), Austin et al. (Citation1989) and Tappin et al. (Citation1994).
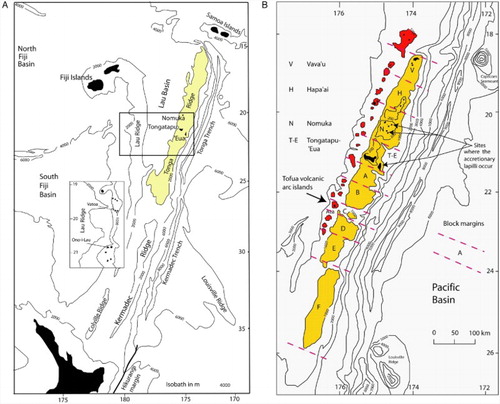
Figure 2. Accretionary lapilli from ‘Eua. A, Layered accretionary lapilli with coarse ash infill. B, Layered accretionary lapilli, some cored, with coarse ash infill. C, Rimmed accretionary lapillus. D, Rare cross-bed in host volcaniclastics.
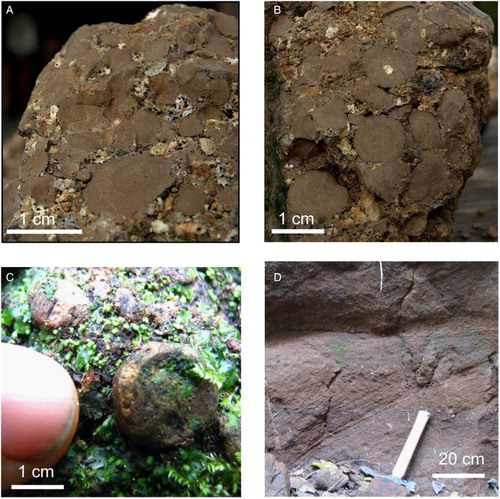
Figure 3. Lau Basin tectonics. A, Synthesis of data centred on the Lau Basin, after Taylor et al. (Citation1996), with c. 20° easterly rotation of the Tonga Ridge (solid black lines) after Sager et al. (Citation1994). B, Outline reconstruction of the ancestral Lau–Tonga ridge, pre-Lau Basin formation, just after splitting commenced, with bathymetric contours. C, Schematic section of the Lau Ridge, Lau Basin and Tonga Ridge with ODP sites at c. 1.5–1.0 Ma after Clift et al. (Citation1995), modified to reflect the work of Parson & Wright (Citation1996).
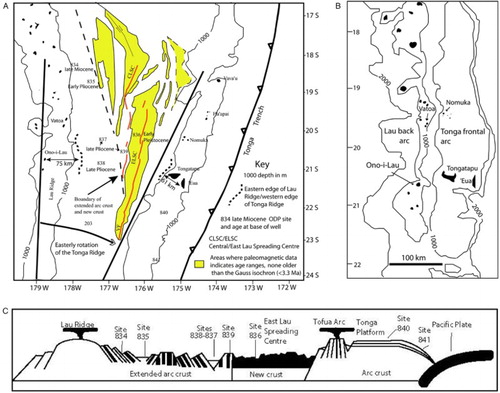
Figure 4. Discontinuity of trends across the boundary between tectonic blocks A, B and T–E. The trend of gravity and arc basement highs on blocks A and B is superimposed on residual magnetic anomaly data from Stevenson & Childs (Citation1985), determined by subtracting the 1975 International Geomagnetic Reference Field (IAGA Citation1976) from the observed total field measurements. The trend of basement highs on block T–E is superimposed on total magnetic intensity data from Gatliff et al. (Citation1994).