Figures & data
Figure 1. Locations of dredge samples and one core collected during TAN1312 cruise, Reinga and Aotea basins. Each dredge location is prefixed by ‘d’ and a site number along the ship track (see ). Not all dredge sites are described in this paper. The one core site collected during TAN1312 and the locations of DSDP Sites 206, 207, 592 and 593 are also indicated. Parts of the coastline between the northern South Island and Northland is indicated for reference. The bathymetry used is taken from CANZ (Citation2008). Inset map of Zealandia shows the location of our study area.
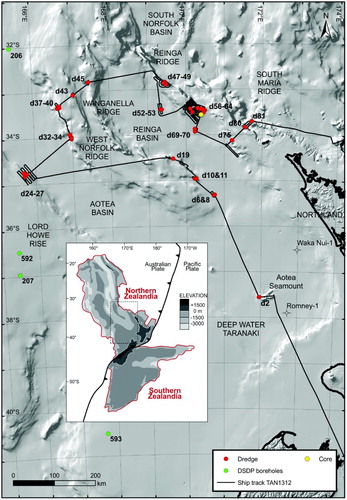
Figure 2. A, Locations of dredge samples from Reinga and Aotea basins with their paleontologically determined ages (by epoch). Further details on sample location and age determinations are provided in . Squares indicate TAN1312 cruise samples (this study), while pre-existing dredge sample ages are depicted as triangles (from Herzer et al. Citation1997, Citation1999). Latitude and longitude coordinates are in NZTM2000 projection. B, Interpreted seismic reflection profile (line REI09-14) through the West Norfolk Ridge and Reinga Basin (location of line shown in A). Seismic units shown relate to nomenclature presented in . The line shows how dredge sites were selected to sample older stratigraphies, in this case, an anticline of folded seismic unit U4 strata (dredge locations d6 and d8). Figure from Bache et al. (Citation2012b).
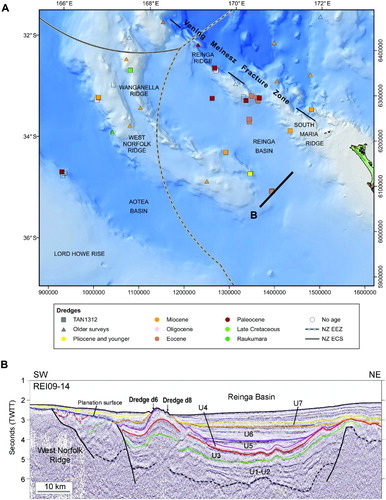
Table 1. Summary of paleontological results.
Figure 3. Seismo-stratigraphic units in the Reinga and Aotea basins and wider Tasman Frontier (the area between New Caledonia and New Zealand), showing corresponding local and regional geological phases (after Bache et al. Citation2012a, Citation2012b) and regional lithostratigraphic correlatives (after Mortimer et al. Citation2014). The age distribution of sandstones, mudstones and limestones (this study) are also shown.
Figure 4. QFL (quartz–feldspar–lithics) ternary plot for sandstones of Reinga and Aotea basins plotted according to age. The Gazzi–Dickinson method was used in these point counts (see – for details).
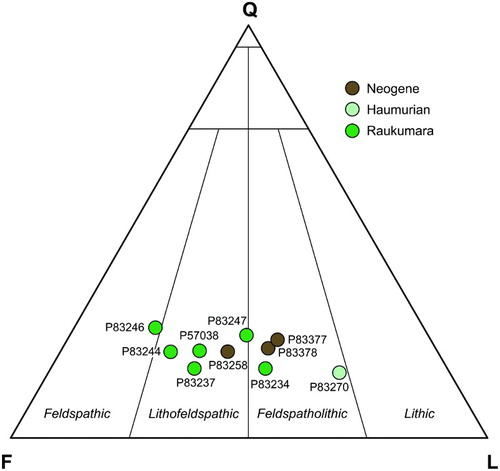
Figure 5. Thin-sections of typical sandstones. Abbreviations: Bt, biotite; Cp, primary carbonate; Cs, secondary carbonate; Glc, glauconite; Pl, plagioclase feldspar; Kf, potassium-feldspar; Ls, sedimentary lithic; Lv, volcanic lithic; Qz, quartz; V, void space (porosity). A, Inferred mid-Cretaceous age moderately sorted lithofeldspathic sandstone. Note the large volcanic lithic grain (dashed line, upper left). Sample P83244, West Norfolk Ridge. Plane-polarised light. B, Mid-Cretaceous age sandstone that is a moderately well-sorted lithofeldspathic sandstone. Sample P57038 (dredge RE9302-5-1 of Herzer et al. Citation1999), West Norfolk Ridge. Plane-polarised light. C, Same view of sample P57038 under cross-polarised light. D, Moderately well-sorted feldspatholithic sandstone of Late Cretaceous age. This sample includes primary carbonate macrofossils and secondary carbonate in the form of sparry calcite. No detrital biotite is present. Sample P83270, Wanganella Ridge. Plane-polarised light. E, Same view of sample P83270 under cross-polarised light. F, Higher magnification of sample P83270 with an example of locally present, well-rounded glauconite. Plane-polarised light. G, Same view of sample P83270 under cross-polarised light.
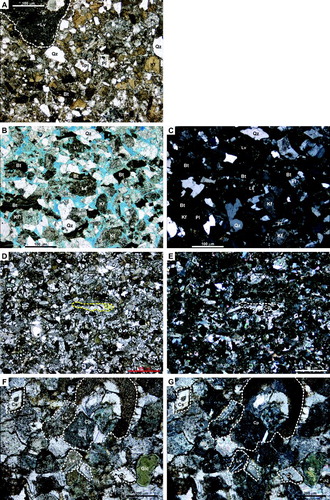
Table 2. Point count data for ten sandstone samples using the Gazzi–Dickinson method.
Figure 6. Thin sections of typical mudstones. A, Haumurian-aged mudstone showing well-laminated, very fine sandy quartzose and micaceous texture. Sample P83271, Wanganella Ridge. Plane-polarised light. B, Late Teurian mudrock displaying a bioturbated fabric comprising ‘sub-horizontal’ or broadly parallel to bedding burrow structures (darker areas). The dark brown patches are possibly Mn-oxides. Sample P83279, north Reinga Ridge. Plane-polarised light. C, Bedded very fine sandy bioturbated non-calcareous Waipawan (early Eocene) siltstone. The sample has very fine-grained detrital quartz, and green and brown glauconite as well as fine-scale Mn contamination. Bioturbation is indicated by the paler colour mottling. Sample P83330, south Reinga Ridge. Plane-polarised light.
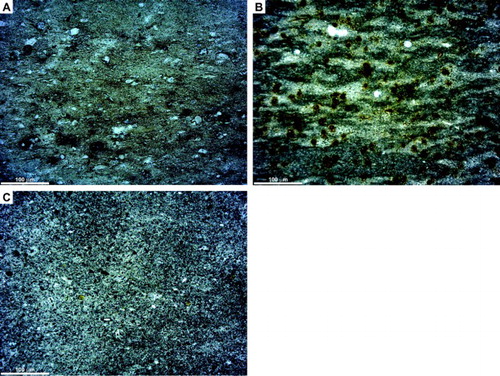
Figure 7. Thin-sections of typical Paleogene limestones. All samples have been stained to reveal calcite and all images are in plane-polarised light. A, Packed biomicrite comprising a mixture of intact and fragmentary foraminifera in a micrite matrix. In this example, foraminiferal tests dominantly contain micrite, although sparry calcite occurs in some. The bivalve fragment (Bi) displays evidence of boring and is coated with a greenish-brown material that is possibly Mn-oxide. Sample P83287, North Reinga Ridge. B, Detailed view of sparry calcite fill in an intact foraminiferal test in a packed biomicrite. Sample P83331, South Reinga Ridge. C, Coarse, bioclastic grainstone comprising almost exclusively large (>millimetre scale) bryozoan skeletal debris. Sample P83197, Wanganella Ridge. D, Coarse bioclastic grainstone comprising predominantly foraminiferal material and what appear to be micritic intraclasts (Mi). Variably sized sparry calcite (arrows) is locally present. Note the rounded glauconite grain (Glc). Sample P83338, South Reinga Ridge. E, Sections through bryozoa displaying intra-particle porosity along with possible partial geopetal micrite infill. Sparry cements (arrows) either partially or completely fill intra-particle pores. The micrite matrix has a pelloidal appearance. Packed biomicrite. Sample P83183, Volcano ‘A’. F, Slightly thick slide displaying echinoderm debris (Ec), planktic foraminifera (Pf), rryozoa (Br) and a bivalve fragments (Bi) that have dissolved leaving large unconnected, mouldic pores. Packed biomicrite. Sample P83170, Anticline ‘A’. G, Typical example of a sparse biomicrite comprising scattered foraminifera (mainly planktic) in a micrite matrix. The dark irregular masses (arrows) are probably Mn-oxides. Sample P83303, Anticline ‘C’. H, Detail of micrite in a fossiliferous micrite with remnant planktic foraminiferal material (Pf). The micrite is relatively coarse grained compared to other micrite examples in , suggesting possible recrystallisation to microspar. Sample P83347, Anticline ‘D’.
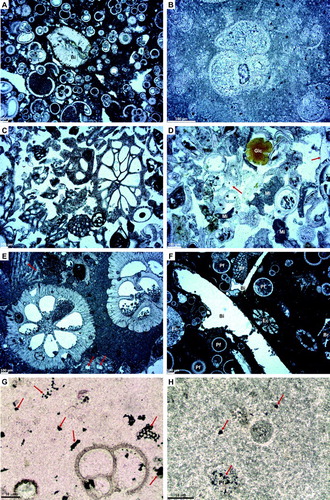
Table 3. Summary of limestone samples.
Figure 8. Thin-sections of typical Neogene sandstone and mudstone and two Cretaceous sandstones; all images in plane-polarised light. Abbreviations: Bt, biotite; Glc, glauconite; Pl, plagioclase feldspar; Kf, potassium-feldspar; Ls, sedimentary lithic; Lv, volcanic lithic; Qz, quartz; Pf, planktic foraminifera; M, mud matrix. A, Waitakian (latest Oligocene–earliest Miocene) sandstone comprising quartz, plagioclase, K-feldspar, sedimentary lithics (mudstone), lath-textured volcanic lithics and glauconite. Rare but conspicuous green and brown amphibole grains are present. Sample P83377, South Maria Ridge. B, Waitakian (latest Oligocene–earliest Miocene) very fine sandy bioturbated calcareous siltstone. Detrital grains include angular quartz, green biotite and rare glauconite. Planktic foraminifera are relatively common throughout. Sample P83380, South Maria Ridge. C, Fine-grained Cretaceous sandstone with a fine-grained mud matrix. This sample had a measured porosity of 27.5% and permeability of 1.1 mD, the low permeability thought to be due to the matrix. Sample P83234, West Norfolk Ridge. D, Cretaceous sample with a measured porosity of 23.8 and 27% and permeability of 3.4 mD. Although the sample has porosity, the result of both depositional sorting and its coarse-grained nature, and secondary porosity due to partial dissolution of feldspar grains and bending of biotite, it has a low permeability, probably because the pore spaces are not well interconnected. Sample P83246, West Norfolk Ridge.
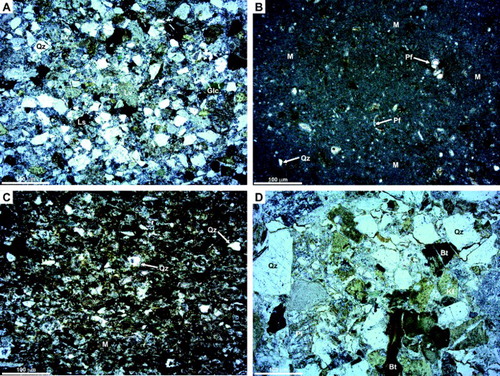
Figure 9. Thin sections of typical Neogene limestones. All samples have been stained to reveal calcite; all images in plane-polarised light. A, Bioclasts comprise echinoderm (Ec), bryozoan (Br) and bivalve (Bi) material. Intra- and interparticle porosity may be filled with fine to coarse sparry calcite (red arrows). A mould, probably of a bivalve, is partially filled with smaller sparry calcite crystals (green arrows) but still retains some porosity (Po). Note that some of the matrix is micritic in this view, although this is not the case elsewhere in the section. A solitary, angular quartz grain is also present. Measured porosity is in the range 6.4–23.5% and probably results from a mixture of intra-particle and dissolution pores. High permeability (580 mD) probably reflects local connectivity between dissolution pores. Packed biomicrite. Sample P83364, southwestern side of the South Maria Ridge. B, Bryozoa (Br) with common intra-particle porosity (Po) and a large fragment of algal material (Alg). Poorly washed biosparite. Sample P83202, Wanganella Scarp. C, Abundant clast-supported planktic foraminifera with scattered benthic foraminifera in a packed biomicrite. Foraminiferal chambers are commonly empty. Sample P83253, West Norfolk Ridge. D, Packed biomicrites displaying matrix- to clast-supported planktic foraminifera plus a solitary sponge spicule (Sp). Sample P83257, West Norfolk Ridge.
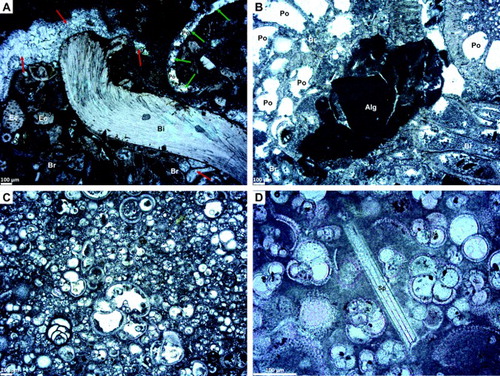
Table 4. Porosity and permeability measurements for sandstones and limestones, Reinga and Aotea basins. Analyses were performed at CoreLabs, New Plymouth (using He) and GNS Science, Lower Hutt (using air).
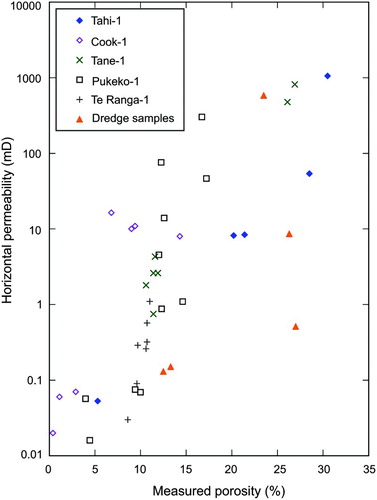
Figure 10. Porosity–permeability values for four Cretaceous sandstones (five analyses) in Reinga and Aotea basins, plotted against typical Cretaceous sandstones in Taranaki Basin (from Higgs et al. Citation2012 and data presented in Table 5). Note that the data were derived by different methods; Taranaki data represent horizontal permeability based on well samples (typically core plugs), whereas our data (also core plugs of the dredged sample) have no particular orientation. Only data from the five analyses undertaken at CoreLabs are shown here. The Reinga and Aotea basin samples have a higher porosity for a given permeability than their Taranaki Basin counterparts.