
Figures & data
Figure 1. Overview of the Christchurch area, showing the epicentres of the Darfield and Christchurch earthquakes (stars), and the areas of interest (AOI) for which we have mapped the effects of liquefaction. Note that the central city area (dashed outline) was mapped on the ground by The University of Canterbury and Tonkin & Taylor, not from aerial image interpretation. Surface trace of the Greendale Fault is from Langridge et al. (Citation2016) and sub-surface fault (green dashed line, location of dipping fault plane as projected to within c. 1 km of the ground surface) is from http://www.gns.cri.nz/Home/Our-Science/Natural-Hazards/Recent-Events/Canterbury-quake/Hidden-fault. Earthquake epicentres are from GeoNet and background map is LINZ Topo250.
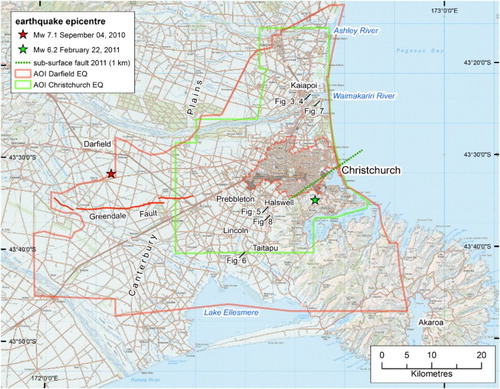
Figure 2. Areas covered by various images used in the analysis. See for image details. Background map is LINZ Topo250.
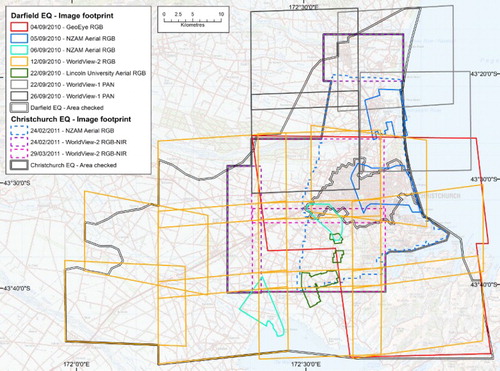
Table 1. Details of images used in this analysis.
Table 2. Attributes assigned to polygons at the time of digitising.
Figure 3. Liquefaction (sand boils, cracking/lateral spread and fissures) east of Kaiapoi, September 2010. The alignment of sand boils and fissures (grey sediment/ejecta) relates to an in-filled former channel of the Waimakariri River (Wotherspoon et al. Citation2012). Image is NZAM 05/09/2010; centre of view approximately 1573200, 5195800 (NZTM). Rectangle indicates location of detail shown in .
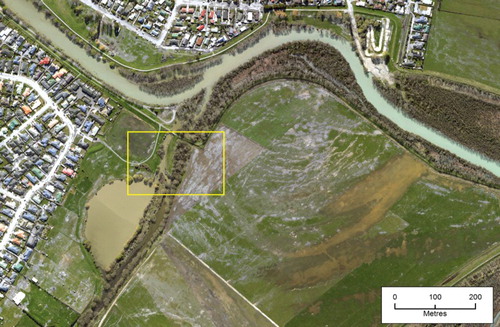
Figure 4. Part of (boxed area) viewed at approximately full image resolution reveals details of the features being mapped.
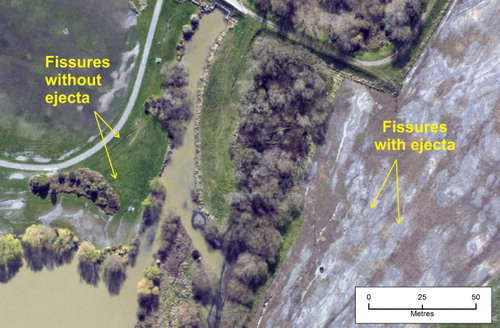
Figure 5. Liquefaction at Rawhiti, south of Halswell, September 2010. Damage includes cracking/lateral spread of the road, and sand boils and flooding (including sedimentation) in the paddocks (image GeoEye 04/09/2010; centre of view approximately 1564800, 5173000).
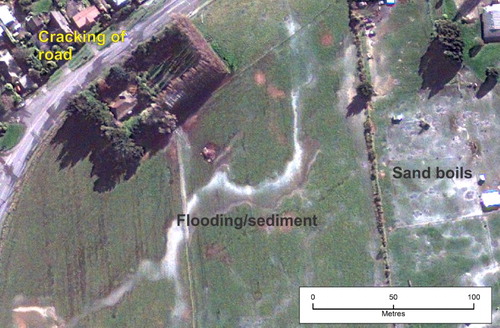
Figure 6. Sand boils and surface flooding across Carters Road, southwest of Taitapu, September 2010 (image WorldView 12/09/2010; centre of view approximately 1560000, 5164000). Note the en-echelon pattern of short fissure segments that merge to form longer contiguous features (e.g. arrows).
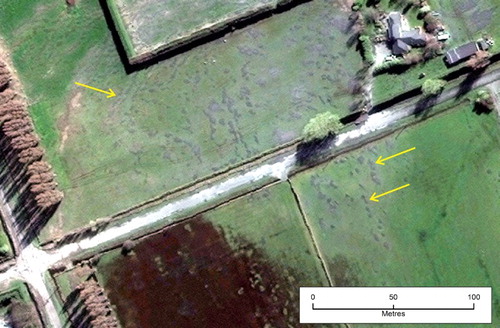
Figure 7. Liquefaction adjacent to the Styx River, west of Brooklands, February 2011. Note the alignment of sand boils parallel to the river margin (arrowed). This area was also affected in September 2010 (image NZAM 24/02/2011; centre of view approximately 1574970, 5194550).
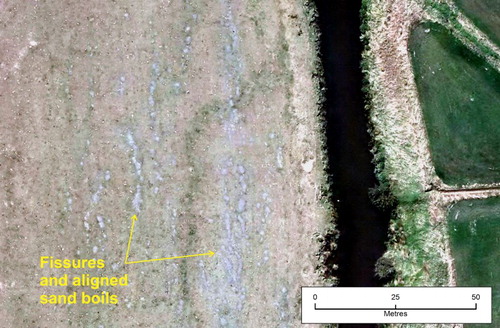
Figure 8. New (darker grey/wet; post February 2011 earthquake) and old (paler grey/dry; pre-February 2011) sand boils west of Lansdowne, February 2011 (image NZAM 24/02/2011; centre of view approximately 1565000, 5171530). Note: there were other earthquakes/aftershocks that caused localised liquefaction (Quigley et al. Citation2013) that was not mapped separately. The various episodes of liquefaction presented in this figure may represent some of these aftershocks, but by far the most damage occurred during the September 2010 and February 2011 earthquakes. Image capture was not frequent enough to determine a higher temporal resolution of damage.
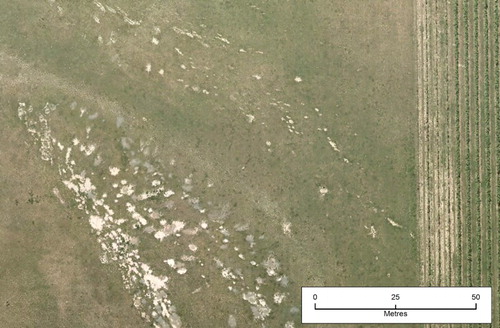
Figure 9. Main area affected by liquefaction from the September 2010 Darfield earthquake. Grey dashed box outlines the area shown on . Note that this map does not display the liquefaction mapping by Tonkin & Taylor – see text for details. See Brackley et al. (Citation2012) and Datasets S1–S2 for full coverage. Epicentre location (black star) is from GeoNet. Background map is LINZ Topo250. Surface geological data from Forsyth et al. (Citation2008) and Heron (Citation2014). This figure includes data extracted from the Canterbury Geotechnical Database (https://canterburygeotechnicaldatabase.projectorbit.com/), which were prepared and/or compiled for the Earthquake Commission (EQC) to assist in assessing insurance claims made under the Earthquake Commission Act 1993 and/or for the Canterbury Earthquake Recovery Authority (CERA). The source maps and data were not intended for any other purpose. EQC, CERA, their data suppliers and their engineers, Tonkin & Taylor, have no liability for any use of the maps and data or for the consequences of any person relying on them in any way.
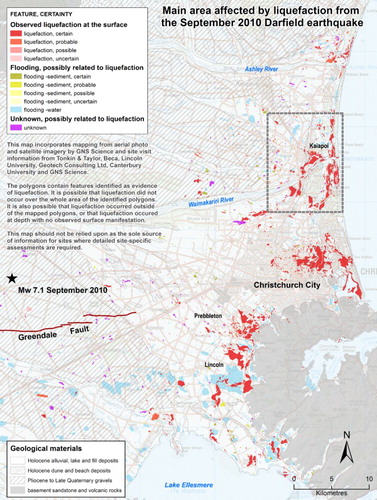
Figure 10. Detailed example of liquefaction mapping in the Kaiapoi area for the September 2010 Darfield earthquake. This map does not display liquefaction mapped by Tonkin & Taylor – see text for details. Note the distribution of observed liquefaction along abandoned river channels and in swampy ground near the coast. See for location. Background map is LINZ Topo50. This figure includes data extracted from the Canterbury Geotechnical Database (https://canterburygeotechnicaldatabase.projectorbit.com/), which were prepared and/or compiled for the Earthquake Commission (EQC) to assist in assessing insurance claims made under the Earthquake Commission Act 1993 and/or for the Canterbury Earthquake Recovery Authority (CERA). The source maps and data were not intended for any other purpose. EQC, CERA, their data suppliers and their engineers, Tonkin & Taylor, have no liability for any use of the maps and data or for the consequences of any person relying on them in any way.
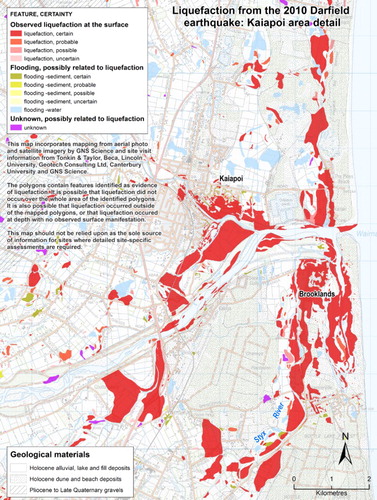
Figure 11. Total mapped area affected by liquefaction from the February 2011 Christchurch earthquake. Comparison with shows much more liquefaction in Christchurch City area and eastern suburbs, reflecting the closer epicentre and therefore locally higher shaking intensities for this event. Some areas were affected by both events. Green dotted line shows projection of dipping subsurface fault plane at c. 1 km depth. Epicentre location (black star) is from GeoNet. Background map is LINZ Topo250. Surface geological data from Forsyth et al. (Citation2008) and Heron (Citation2014). This figure includes data extracted from the Canterbury Geotechnical Database (https://canterburygeotechnicaldatabase.projectorbit.com/), which were prepared and/or compiled for the Earthquake Commission (EQC) to assist in assessing insurance claims made under the Earthquake Commission Act 1993 and/or for the Canterbury Earthquake Recovery Authority (CERA). The source maps and data were not intended for any other purpose. EQC, CERA, their data suppliers and their engineers, Tonkin & Taylor, have no liability for any use of the maps and data or for the consequences of any person relying on them in any way.
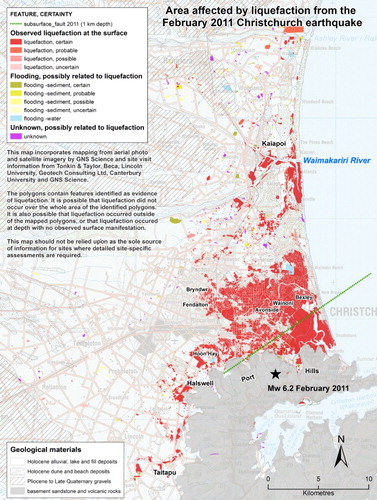
Figure 12. Furthest distance from the epicentre (![]()
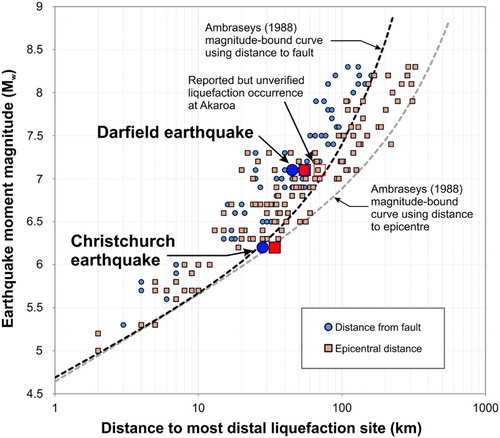
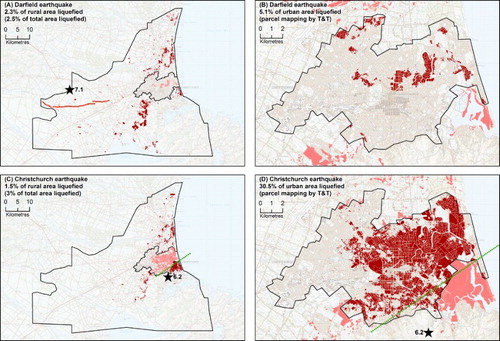
Figure 13. Comparison of the distribution of liquefaction for the Darfield and Christchurch earthquakes in the rural and residential areas (mapped separately), as a proxy for comparing liquefaction severity between the two events. A, The Darfield earthquake affected c. 2.5% of the total area assessed. B, Because of its more distant source, only the most susceptible materials in the city (5% of mapped urban area) were affected. C, The Christchurch earthquake affected c. 3% of the same total area as in A. D, The proximity of the epicentre directly beneath the liquefaction-prone soils of the city and the consequently higher local PGA values resulted in more severe liquefaction, affecting both highly and moderately susceptible soils (c. 30% of mapped urban area). Epicentres are shown by black star and sub-surface fault (at 1 km depth) by green dashed line.
A1.1 Names and description of fields in the accompanying GIS datasets