Figures & data
Figure 1. Modern SST (March 2013; Naval Research Laboratory–Navy Coastal Ocean Model [Internet]. Available from: http://www7320.nrlssc.navy.mil/) and positions of the main water bodies, fronts and surface currents in the western sector of the Southern Ocean (after Orsi et al. Citation1995). S-Tasman Rise, South Tasman Rise; Ch. Rise, Chatham Rise; SEC, South Equatorial Current; EAC, East Australia Current; EAUC, East Auckland Current; ECC, East Cape Current; TF, Tasman Front; N-STF, North Subtropical Front, S-STF, South Subtropical Front; STFZ, Subtropical Frontal Zone; SAF, Subantarctic Front.
![Figure 1. Modern SST (March 2013; Naval Research Laboratory–Navy Coastal Ocean Model [Internet]. Available from: http://www7320.nrlssc.navy.mil/) and positions of the main water bodies, fronts and surface currents in the western sector of the Southern Ocean (after Orsi et al. Citation1995). S-Tasman Rise, South Tasman Rise; Ch. Rise, Chatham Rise; SEC, South Equatorial Current; EAC, East Australia Current; EAUC, East Auckland Current; ECC, East Cape Current; TF, Tasman Front; N-STF, North Subtropical Front, S-STF, South Subtropical Front; STFZ, Subtropical Frontal Zone; SAF, Subantarctic Front.](/cms/asset/c61c34db-90f0-4371-a41b-c7040751bb60/tnzg_a_1195756_f0001_c.jpg)
Figure 2. Magnetic polarity stratigraphies for ODP Sites 1171 and 1125 constructed from shipboard, 20 mT demagnetisation data measured on working half cores. Nannofossil FADs and LADs, and existing age models of Hayward (Citation2002) and Schaefer et al. (Citation2005) guide the correlation with the magnetic polarity timescale (Gradstein et al. Citation2012).
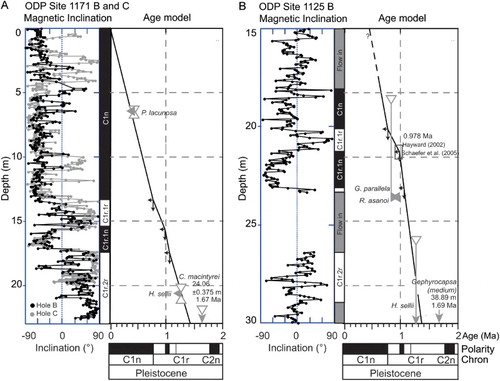
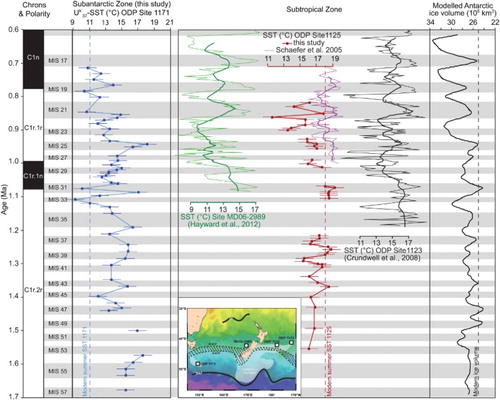
Figure 3. Summary of the evolution of the Subantarctic and Subtropical zones in the southwest Pacific sector of the Southern Ocean during the Early Pleistocene. The SAW are depicted by the alkenone-derived SSTs from ODP Site 1171. For the Subtropical Zone, we base our interpretations on SSTs from ODP Site 1125 (alkenone-derived SSTs from this study, modern analogue technique (MAT)-derived SSTs from Schaefer et al. Citation2005), ODP Site 1123 (Crundwell et al. Citation2008) and MD06-2989 (Hayward et al. Citation2012). For MAT-derived SSTs, the thick lines represent the 40 kyr smoothed records. For alkenone-derived SSTs, the error bars are shown. Each warm marine isotope stage (MIS) is shaded in grey and the extension of the Mid-Pleistocene Transition (MPT) is indicated by the vertical thick black bar. Modelled 40 kyr smoothed record of the Antarctic ice volume is from Pollard and Deconto (Citation2009).