
Figures & data
Figure 1. (a) Geological formations of geophysical relevance, simplified from Edbrooke (Citation2001). The outline of and is indicated by a thick dashed line. Graticule: NZMG, grid interval 10 km. (b) Locality diagram for this study, also showing the location of the Junction Magnetic Anomaly causative body (JMB), Median Tectonic Zone (MTZ) and Hikurangi–Tonga–Kermadec Trench. Compiled from Hunt (Citation1978) and Bradshaw (Citation1993).
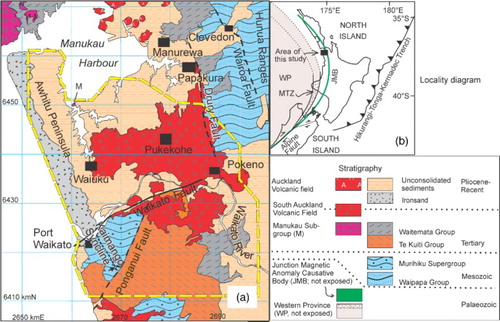
Figure 2. Aeromagnetic anomaly map. Colour, total magnetic intensity (TMI) anomaly, ‘Sun-shading’ from northeast. Annotations ‘a’ to ‘l’ are discussed in the text. Graticule: NZMG, grid interval 10 km.
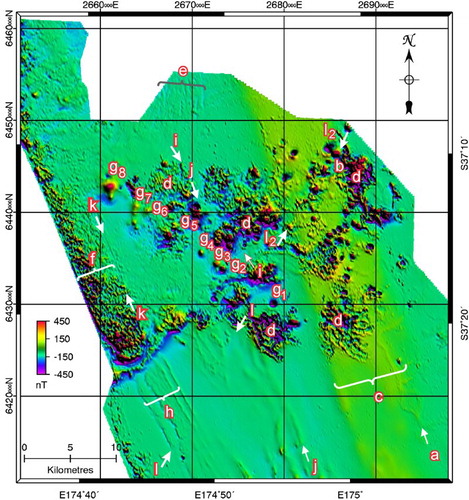
Figure 3. Total magnetic intensity (TMI) anomaly as grey-scale illuminated from 250° with a ‘sun elevation’ of 15°. The path of the Waikato River is indicated by a thin dashed white line traced from . Some northeast fault traces are indicated by pairs of white arrows.
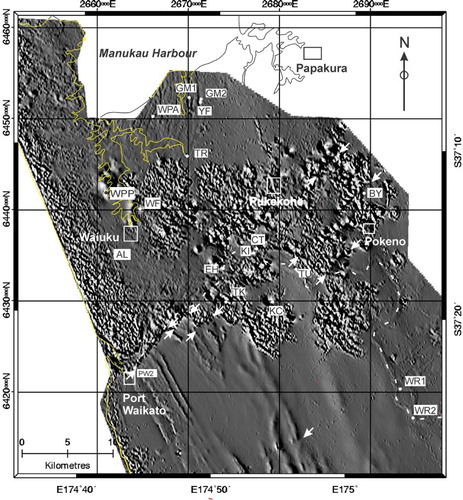
Figure 4. (a) Digital terrain map on which are superimposed the same arrows as shown in . (b) The same set of arrows superimposed on fault traces from Edbrooke (Citation2001). Concealed faults, dotted lines; approximate faults, dashed lines. Graticule: NZMG, grid interval 10 km.
Figure 5. (a) Aeromagnetic total magnetic intensity (TMI) anomaly profile for survey flight line 6448.5 km north , NZMG, running east-west. The parameters of the model are: overburden, 900 m; width of dyke, 8000 m; vertical extent of dyke, 10 km; magnetisation, 0. 5 A/m; declination of magnetisation, 000°; inclination of magnetisation –60°; strike of JMB, 338°; dip of JMB, 90°; local ambient field strength, 54.368 µT; ambient magnetic field declination, 20°; ambient magnetic field inclination, –63°; regional geomagnetic field intensity gradient, 0.0 nT/km. (b) Edges of JMB (thick light-grey bars) inferred from steepest gradient in TMI anomaly, using Ford filter, compared with points (white circles) identified as edges in Figure 5(b). The thickness of the light-grey bars, represents the uncertainty. Wavy ornament: Mesozoic greywacke. “S” and “A” ornament: South Auckland and Auckland Volcanics respectively. (c) Base model (i), as for Figure 5(a), perturbed, one parameter at a time, by: (ii) decreasing overburden to 400 m, (iii) decreasing dip of prism to 60°E, (iv) increasing declination of magnetisation to 20°E, and (v) decreasing vertical extent to 3 km.
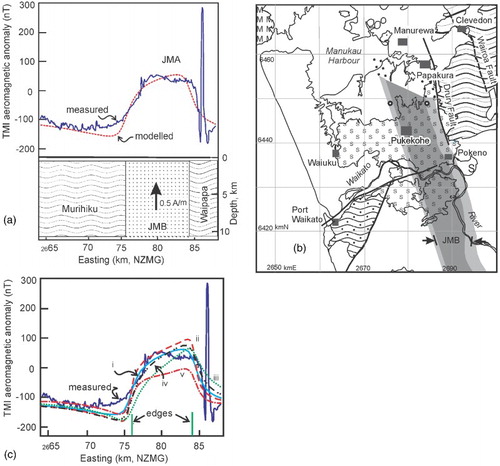
Figure 6. Geology from map of Edbrooke (Citation2001) with South Auckland Volcanic Field in red draped on analytical signal from the magnetic data as a sun-shaded relief image with northeast ‘sun illumination’. Graticule: NZMG, grid interval 10 km. Base map: Copyright Reserved, GNS Science.
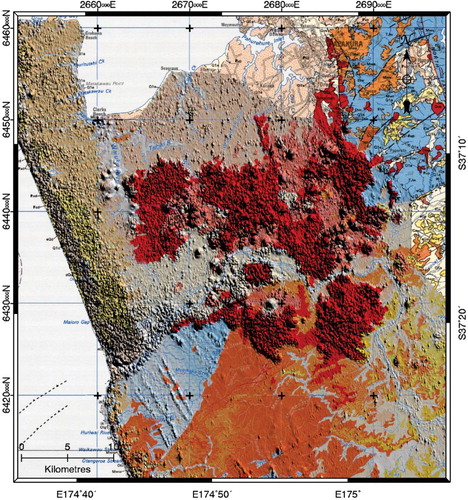
Figure 7. Comparison of aeromagnetic total magnetic intensity (TMI) anomaly (solid) with ground based TMI anomaly (stars), modelled aeromagnetic anomaly (dashed) and ground magnetic anomaly (dot-dash), for profiles cutting the arcuate anomalies. The aeromagnetic survey line is on 6451852 mN (NZMG) and the ground magnetic survey line lies between 6452193 and 6452141 mN (NZMG). The ground magnetic anomaly curve has been transposed downwards by c. 120 nT for visual clarity.
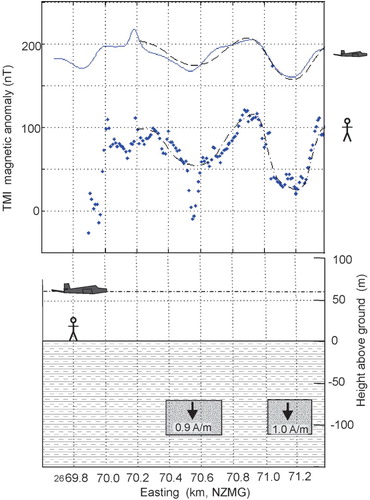
Figure 8. Zones of high analytical signal (dot pattern) superimposed on the geological map of the Port Waikato area taken from Edbrooke (Citation2001). Ijh, Huriwai Group; IJa, Apotu Group; Jk, Kirikiri Group; mJr, Rengarenga Group; Jn, Newcastle Group. Graticule: NZMG. Grid interval 10 km.
Figure 9. (a), (b) Extracts from aeromagnetic survey lines PW2 and PW3, respectively, and models applied to them. Magnetisation magnitudes modelled for the magnetised prisms are indicated in italics. Upper curves; measured total magnetic intensity (TMI) anomaly, relative to international geomagnetic reference field, IGRF, (solid blue) and composite model (dashed red). Lower curves: models for individual prisms. Arbitrary base level shifts have been applied to the models for clarity.
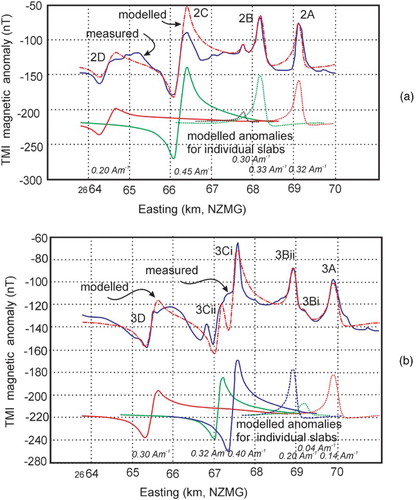
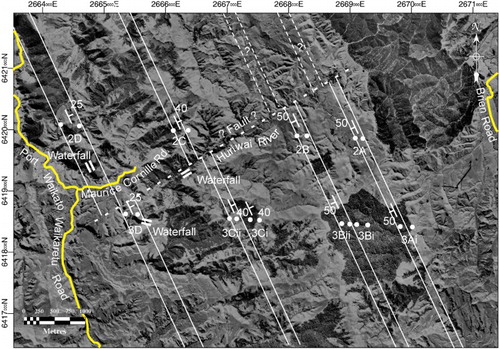
Figure 10. Surface expression of magnetically enriched horizons modelled near Port Waikato. The edges of modelled magnetised prisms are shown as white dots, in the planes of the flight lines, superimposed on the aerial photograph. Thin white lines indicate likely edges of the magnetic horizons. Strike (assumed to be 155°) and dip adopted for models are shown in white. Graticule: NZMG, interval between ticks 1000 m. Aerial Photograph: Land Information NZ; Crown Copyright reserved.