Figures & data
Figure 1. Terrestrial topography corrected gravity anomalies (mGal) over New Zealand’s North, South and Stewart islands. The point wise measurements shown as dots coloured by value.
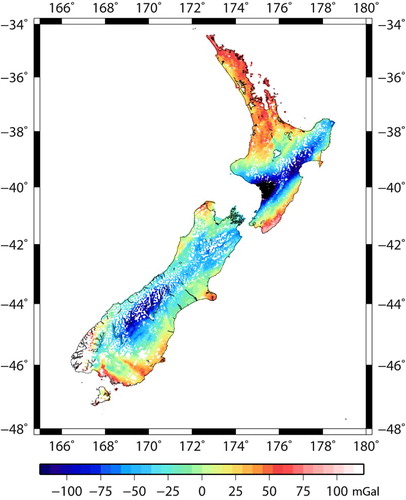
Figure 2. Terrestrial topography corrected gravity anomalies error standard deviations (mGal) estimated by propagating height uncertainties into the Bouguer and free air corrections. The error estimates are shown as dots coloured by value.
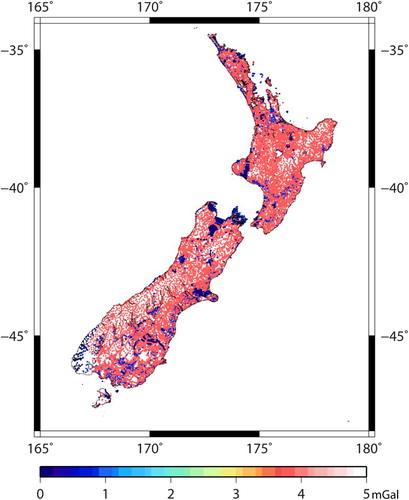
Figure 3. Airborne topography corrected gravity anomaly data (mGal) shown along each flight line coloured by value. Data which has been removed can be seen by the white space along the tracks and amounts to around 7% of the total data set.
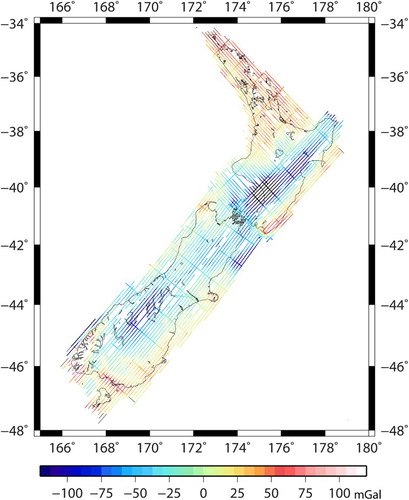
Table 1. Cross-over statistics of the shipborne gravity data.
Figure 4. Shipborne topography corrected gravity anomaly data (mGal) shown as dots coloured by value over the region 25°S to 60°S and 160°E to 170°W.
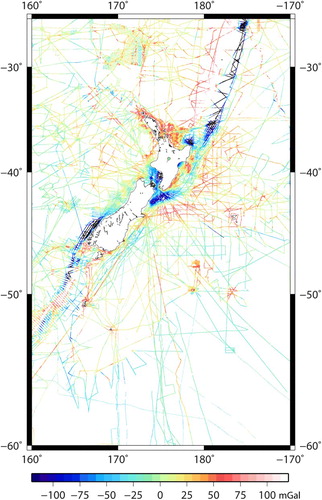
Figure 5. Grid of Sandwell et al. (Citation2014) satellite altimetry-derived gravity anomaly (mGal) corrected for topography (masked on shore) over the region 25°S to 60°S and 160°E to 170°W.
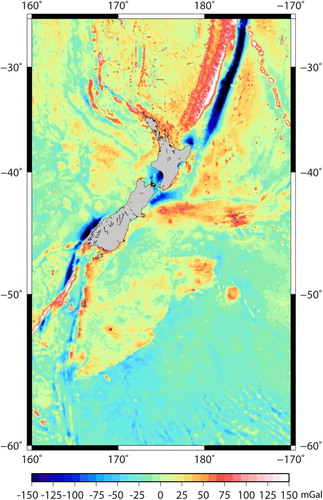
Figure 6. Grid of Sandwell et al. (Citation2014) satellite altimetry-derived gravity anomaly error standard deviation (mGal) (masked on shore) over the region 25°S to 60°S and 160°E to 170°W. The error values are larger in coastal regions.
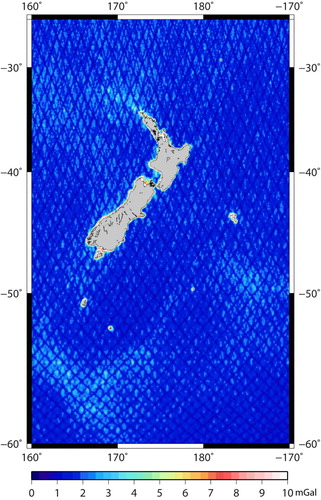
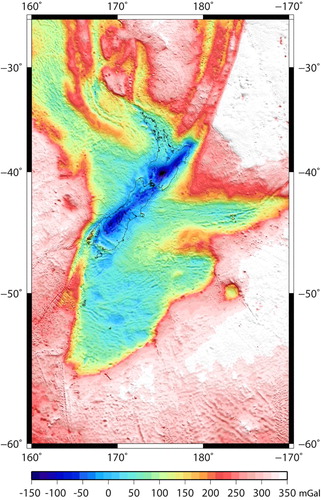
Figure 7. One arc-minute grid of airborne, terrestrial, shipborne and satellite altimetry-derived topography corrected anomaly data combined by least squares collocation over the region 25°S to 60°S and 160°E to 170°W. This shows the strength of the Earth’s gravity minus the gravitational effect of topography and an Earth approximating ellipsoid.
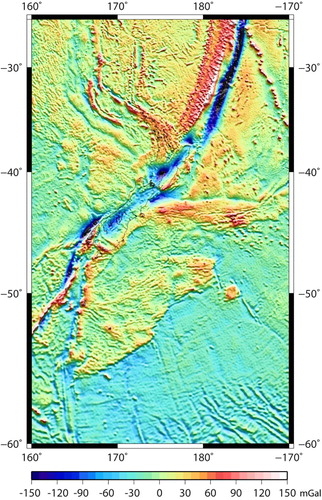
Figure 8. Gridded gravity anomaly error standard deviations (mGal) propagated from the airborne, terrestrial shipborne and satellite altimetry measurement errors by least squares collocation.
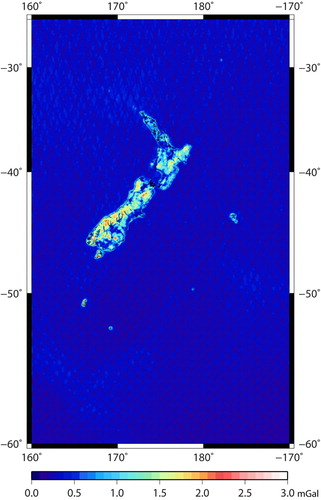
Figure 9. One arc-minute grid Faye anomalies over the region 25°S to 60°S and 160°E to 170°W showing the strength of the Earth’s gravity minus the gravitational effect of an Earth approximating ellipsoid and the effect of topography relative to the topographic height at each grid point.
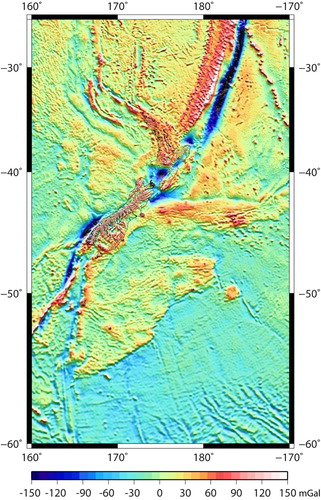
Figure 10. One arc-minute grid of free air anomalies (mGal) over the region 25°S to 60°S and 160°E to 170°W showing the strength of the Earth’s gravity minus the gravitational effect of an Earth approximating ellipsoid.

Table 2. Gradient summary statistics of the 1 arc-minute block averaged topography.
Figure 11. One arc-minute grid of Bouguer anomalies (mGal) over the region 25°S to 60°S and 160°E to 170°W. This shows the strength of the Earth’s gravity minus the gravitational effect of an Earth approximating ellipsoid and the topography above mean sea level and replacing the gravitational effect of seawater with the effect of rock with density 2.67 Mg/m3.