Figures & data
Table 1. Physical properties measured and calculated from drill core data on northern Zealandia.
Figure 1. Location figure for northern Zealandia. The main basins and rises are labelled. (⬤) DSDP boreholes used for velocity and lithology information in this study (Burns et al. Citation1973a, Citation1973b, Citation1973c; Kennett et al. Citation1986b). (▴) DSDP borehole used for heat flow data (Kennett et al. Citation1983). (⬤) Taranaki Basin wells. The dashed black line outlines northern Zealandia, and the red dashed box is the location of the inset. Inset shows the Sonobuoys (⬤) and the Geoscience Australia seismic array (GA-302, lines) on the northern Lord Howe Rise used for velocity analysis (Petkovic Citation2010). The red line is multichannel seismic line GA-302-09. Yellow lines show the coverage of the sonobuoys that recorded velocity data and coincide with the locations of the multichannel seismic data sections shown in .
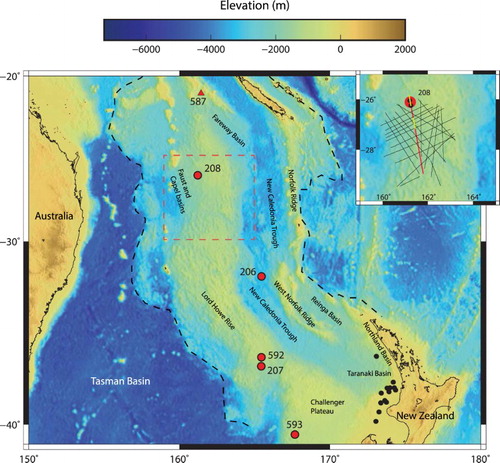
Figure 2. Stratigraphic columns showing main lithology at the DSDP boreholes and the regional unconformities. Adapted from Burns et al. (Citation1973a, Citation1973b, Citation1973c) and Kennett et al. (Citation1986b). Physical property data and co-incident seismic records are shown in for DSDP sites 208, 206, 207 and 592.
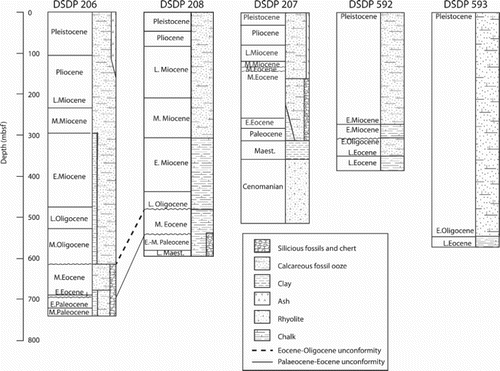
Figure 3. Physical property data from DSDP sites in northern Zealandia. Plot shows raw (▴) and corrected drill core (red and black lines) derived measurements of velocity and density. Velocity and density measurements are plotted as white circles when they are interpolated from adjacent measurements. The third graph shows impedance (ρVp). A, DSDP 208, Lord Howe Rise, north. B, DSDP 206, New Caledonia Trough. Note the similar thickness of the Eocene low-velocity zone (630–680 mbsf). C, DSDP 207, Lord Howe Rise south. Note the good degree of fit between the drill core derived and synthetic data attributed to greater sampling frequency in the core. D, DSDP 592, Lord Howe Rise, south. The low-velocity/density anomaly associated with the regional unconformity is small and likely due to slumped sediments on top of the horizon.
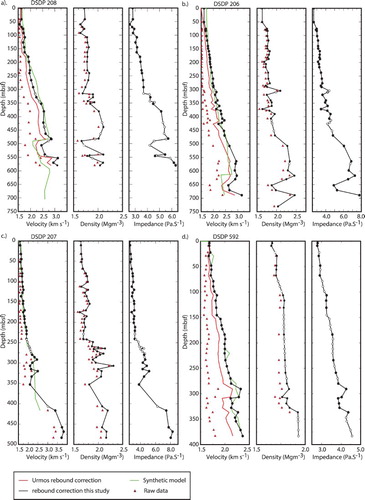
Figure 4. A, Panel 1: section of seismic data from seismic line GA-302-09 at the DSDP 208 site. Circled numbers refer to lithological units in . The seafloor reflection on all seismic data is a strong and positive polarity, and is used to normalise amplitudes for synthetic models and to provide a zero point in TWT for the data in panels 1 to 4. Note the change in reflectivity at c. 220 ms TWT associated with increased lithification and at 300 ms TWT with the occurrence of chalk in the drill core. Note the strong negative polarity reflection at c. 490 ms TWT associated with the Eocene/Oligocene unconformity and the two strong positive reflections at 540 ms TWT (impure chert) and 580 ms TWT (opal-A/CT transition) associated with silicification. Panel 2: smoothed amplitude. The plot shows squared reflection amplitudes with a moving average (40 ms window) filter. The plot highlights general changes in reflection energy with depth. Panel 3: real (red) and synthetic (black) seismic data at the borehole. The synthetic data are a first-order fit to the observed amplitude and phase of the main reflection events at the site. The velocity model used to create the synthetic data is shown in (A) (green line). Panel 4: reflection coefficients calculated from the corrected well velocity and density data (red) and the synthetic model (black). Note the reduction in reflection coefficients in the synthetic data. B, Comparing lithology with seismic characteristics. DSDP 206, New Caledonia Trough. Panel 1: section of seismic data from seismic line TL-01 at the DSDP 206 site. For other plot details see (A). The velocity model used to create the synthetic data in panel 3 is shown in (C) (green line).
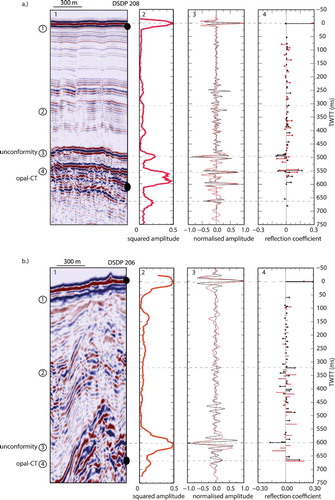
Figure 5. A, Comparing lithology with seismic characteristics. DSDP 207, Lord Howe Rise, south. Section of seismic data from seismic line TAN1409-LHRS_12 at the DSDP 207 site. For other plot details see (A). The velocity model used to create the synthetic data in panel 3 is shown in (C) (green line). B, Comparing lithology with seismic characteristics. DSDP 592, Lord Howe Rise, South. Section of seismic data from seismic line TAN1409-LHRS_01 at the DSDP 592 site. For other plot details see (A). The velocity model used to create the synthetic data in panel 3 is shown in (D) (green line).
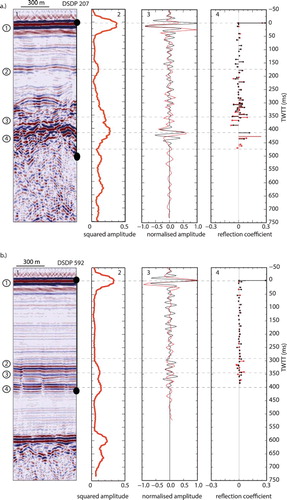
Figure 6. Empirical solutions for velocity with depth on the North Lord Howe Rise. The blue line is the wide-angle, forward modelling (ray tracing) solution for velocity with depth at the borehole from sonobuoy data (Petkovic Citation2010). This velocity model is from refracted arrivals only and the step increase in VP at 470 mbsf is too shallow due to the hidden layer of Eocene low-velocity sediments. The brown line indicates interval velocities calculated from seismic reflection data on the northern Lord Howe Rise (Petkovic Citation2010). Velocity with depth solutions based on Taranaki Basin sediments (yellow line, see Supplementary data) and Ontong Java carbonates (red line, derived from Urmos and Wilkens, Citation1993) are plotted for comparison. The green line is the best fit synthetic model for DSDP 208 sediments, which best resolves the low velocity layer at c. 500 mbsf.
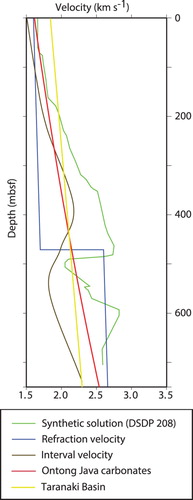
Figure 7. Stacked and migrated multichannel seismic data (GA-302-09, red line, inset.) from the GA-302 seismic survey near DSDP 208 (Petkovic Citation2010a). A, The section of the GA-302-09 seismic line intersects DSDP 208, and the plot shows the borehole location and main lithologies in the core. The black line is the seismic trace extracted at DSDP 208 borehole. The main reflections on the seismic trace are matched to changes in lithology (). Note the flat reflection at CDP 27200 locally truncates stratigraphic horizons and can be traced laterally to the opal-A/CT transition observed in the core at the borehole. The black dashed line is the trace of the reflection back to the borehole. The Eocene unconformity is a reverse polarity reflection. The small faults in the chalk and ooze layers are interpreted as polygonal faulting. B, The section of the GA-302-09 seismic line is c. 100 km south of the DSDP 208 borehole. Figure shows the opal-A/CT transition truncating stratigraphic horizons. The seismic trace extracted at CDP 18100 shows very similar characteristics to the one from the borehole in (A) and lithological interpretations are inferred by linking the seismic signature to known lithology at DSDP 208.
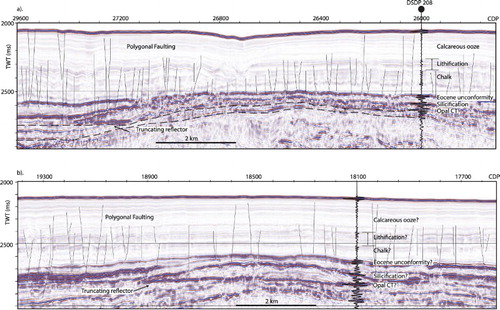
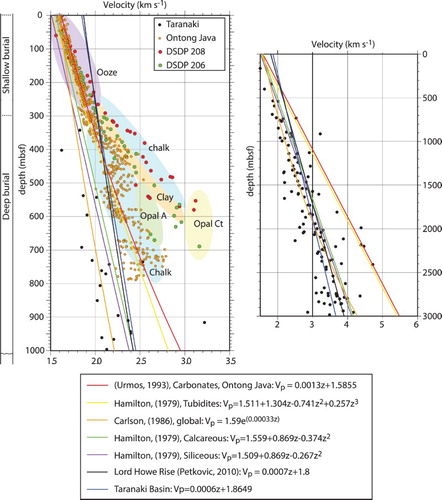
Figure 8. A, Empirical solutions for seismic velocity with depth. Equations and sources are shown in the lower panel. Solutions are from the literature and based on seismically constrained borehole measurements (Hamilton Citation1979; Carlson et al. Citation1986; Urmos and Wilkens Citation1993; Petkovic Citation2010). The equation for Ontong Java is calculated from the rebound corrected data of Urmos and Wilkens (Citation1993) in this study. A range of velocity gradients is predicted by the studies; however, none produce a good fit to the rebound-corrected data from northern Zealandia (DSDP 206 and 208). Note the step in Vp between opal-A and opal-CT. Coloured shapes are used to group the velocity–depth data points into their main lithology/diagenetic states. The plot on the right shows the velocity with depth relationships extrapolated to 3 km depth.