Figures & data
Figure 1. Location maps for the Waiuta town and associated mining and processing sites. A, Waiuta in relation to some other gold mines in the Reefton Goldfield. B, The Blackwater and Snowy River catchments that drain the area, with Prohibition and Blackwater mine shaft sites and Snowy River processing site. C, Waiuta ghost town, showing the local drainage and topography in the region of Prohibition site of this study.
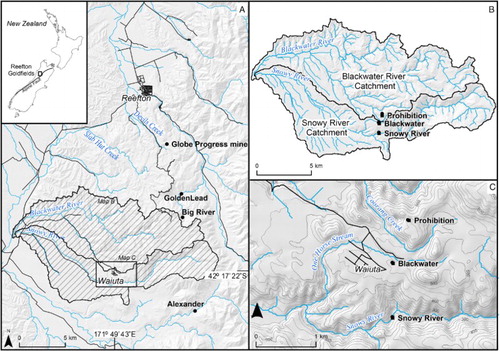
Figure 2. Flow chart showing the pathways for processing of the ore (entering from centre right) from ore separation into silicate and sulphide-rich portions (purple, right), and the downstream wastes and products of the mine. Mine wastes are around perimeter of diagram, with those relevant to this study in red boxes.
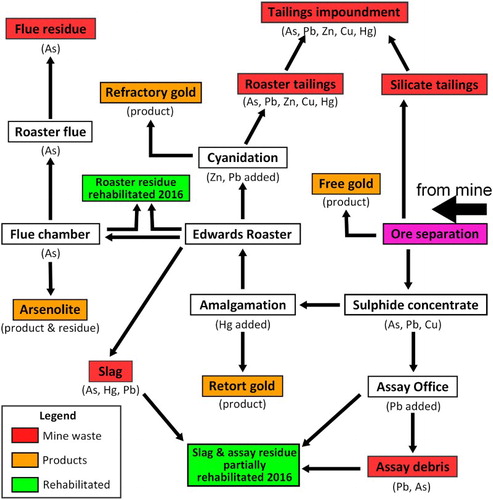
Figure 3. Physical setting of the Prohibition mine wastes. A, Aerial view of the Prohibition site before the 2016 rehabilitation, showing the locations of tailings, slag and assay debris of this study in relation to the main processing site. Field X-ray fluorescence measurement sites from this study (Table S1) are indicated, with representative spots in the rehabilitation area from Haffert and Craw (Citation2009) for comparison. B, Photograph of a block of slag. C, Photograph from the rehabilitated processing plant area, viewed towards the rehabilitated wetland (yellow arrow in A), taken in November 2016. D, Photograph of natural revegetation of the red tailings, at site indicated in A.
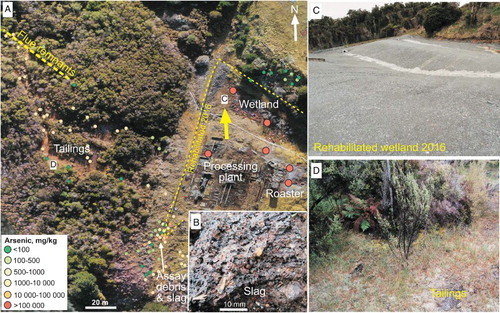
Table 1. Characteristics of the mine wastes which remains on site; tailings material, flue residue, assay debris and slag.
Figure 4. Images of red tailings material. A, Hole dug in tailings, showing the bedding and varying arsenic concentrations down the hole. B, Scanning electron microscopy backscatter image showing rhombic-shaped pseudomorphs of arsenopyrite (aspy), cubic-shaped pseudomorphs of pyrite (py), quartz (qtz), and some non-porous maghemite. C, Energy-dispersive spectroscopy arsenic map of red tailings, showing the heterogeneous distribution of arsenic on the micron scale with the high arsenic cements and metal(loid) oxides.
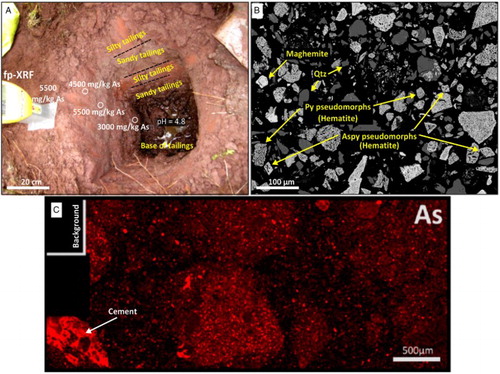
Figure 5. Scanning electron microscopy images of the cement in the red tailings, with electron backscatter image at top showing a particle from roaster with a partially oxidised rim and two generations of cementation. Energy-dispersive spectroscopy element maps (middle and bottom) show the distribution of Fe, S, As and Si in the immediate vicinity of the roaster particle (indicated in boxes).
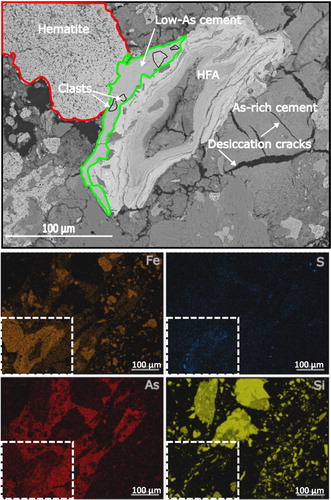
Figure 6. Scanning electron microscopy images of flue residues. A, Backscatter electron image of porous haematite and quartz from the tailings material in the flue residues. B, Backscatter electron image of typical flue residues with detrital feldspars, organic material, and As, Fe oxides. C, Backscatter electron image of a scorodite particle, with As and Fe element maps, D, Backscatter electron image and As, Mn maps of Fe–Mn–As-oxide, showing localised distribution of As in the surrounding material. E, Backscatter electron image and As, Fe maps of skeletal Fe–As material in a detrital particle.
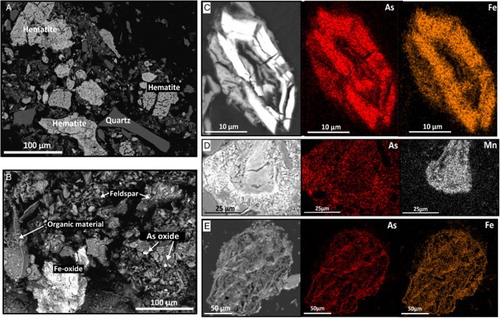
Figure 7. Scanning electron microscopy images of slag material. A, Backscatter electron image showing quartz particles (pale grey) and Fe-oxyhydroxides (white). B, Backscatter electron image of crystalline Fe oxide formed in voids, and at least two compositions of Fe oxyhydroxides as indicated by the variation in greyscale. C, Backscatter electron image of relict arsenopyrite (aspy, pale grey) embedded in Fe oxyhydroxide, with energy-dispersive spectroscopy maps of As and S.
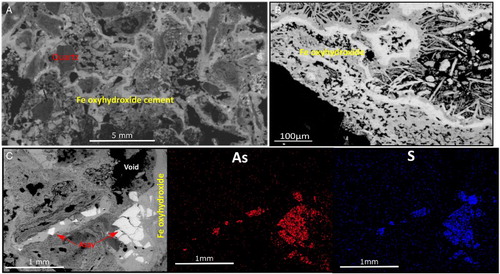
Figure 8. Assay office debris. A, Photograph of cupels and associated fine-grained veneer in soil. B, Plot (log scale) of As vs Pb for the fine-grained veneer in and around deposits in A. C, Ternary diagram of relative As, Pb and Zn contents of assay office debris compared with the mine wastes. D, Plot of Cu vs Hg for assay office debris (green) compared with nearby slag and tailings.
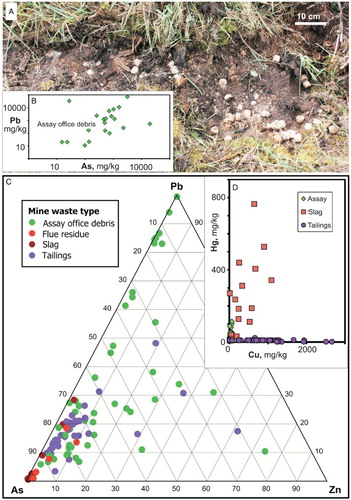
Table 2. Surface water samples collected from Prohibition tailings area in this study (first three samples), with some other Prohibition waters and waters from Globe historic mine areas for comparison.
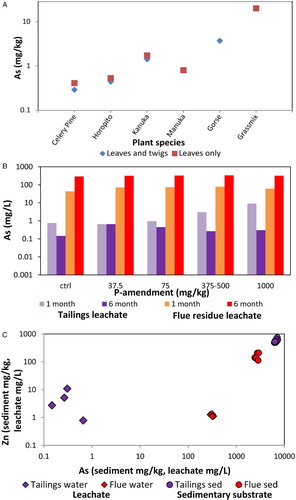
Figure 9. Environmental mobility of As and metals in Prohibition mine wastes. A, Arsenic uptake by various plant species growing on tailings. B, Experimental leaching of As (after 1 and 6 months) from samples of tailings and flue residues with a range of phosphorus amendments. C, Comparison of leaching of As and Zn from tailings and flue residue samples, in relation to the As and Zn contents of the substrates.