Figures & data
Figure 1. Locations of wall wash sampling sites. BCM, Brunner Coal Measures; PCM, Paparoa Coal Measures.
Figure 2. Rainfall data in the Reefton and Buller areas around the time wall wash data was collected (Reefton data is from NIWA and Buller data is from Solid Energy NZ Ltd).
Figure 3. Photographs of sampling sites showing distribution of precipitates. A, Site A pit wall −3 days old. B, C, Site B pit wall. D, Site C road cut. E, Site D pit wall. F, Site E portal cutting.
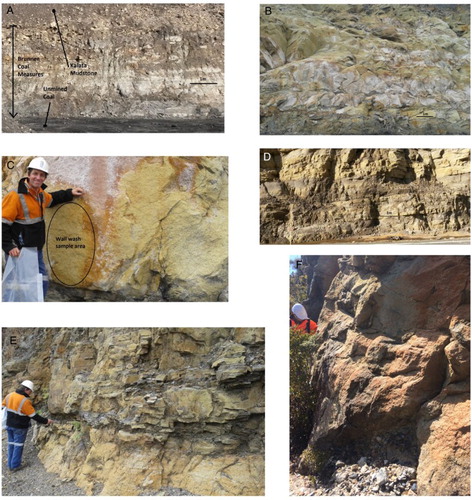
Table 1. Sample descriptions, pH values and calculated acidity for wall wash samples.
Table 2. Major cation and trace element concentrations in wall wash samples.
Figure 4. Average acidity data with power function fit to data from 1 to 62-year-old pit walls. (♦) 3 day data, not included in the fit.
Figure 5. Average composition of acidity released by pit walls of different ages.
Figure 6. Relationships between Zn and selected trace element concentrations in all wall wash samples: A, Ni; B, Co; C, Mn; and D, Cd.
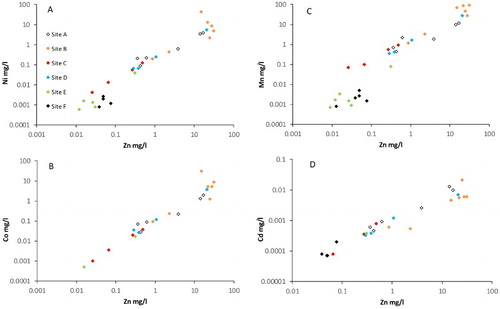
Figure 7. Relationship between Zn concentration in wall wash and acidity release.
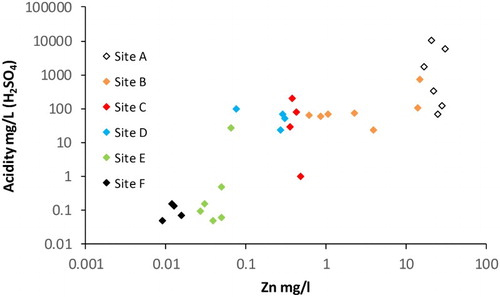
Figure 8. Raw data and averaged acidity data from wall wash samples with values for acidity in un-impacted streams from Brunner Coal Measures. Stream chemistry values are during low flow.