Figures & data
Figure 1. Location maps for the Waikaia placer mine and regional context for alluvial gold. A, The Otago Schist goldfield in the South Island of New Zealand. B, Hillshade topographic image of Central Otago and Eastern Southland goldfields, with locations of principal Cenozoic gold paleoplacers that have formed sources for gold in younger deposits during uplift and recycling. C, Coarse proximal gold nuggets with variable rounding, from the Nevis River catchment (top; Hesson et al. Citation2016), and a gold flake with folded edges from paleo-Clutha River channel (bottom; Stephens et al. Citation2015). D, Hillshade topographic image of the Waikaia River catchment and neighbouring rivers, with locations of principal gold mines in Pleistocene auriferous paleochannels. E, Placer gold from Waimumu Pliocene paleochannels, including flattened and folded flakes (top) and more proximal small nuggets (bottom).
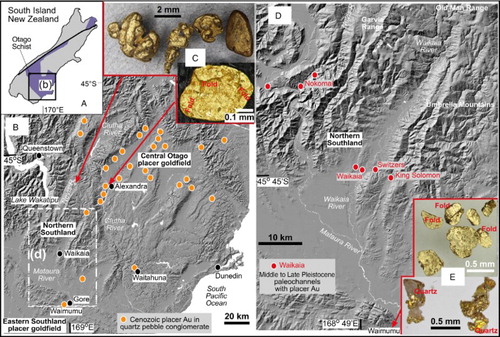
Figure 2. Maps of the Waikaia placer gold mine site. A, General location of the mine in a Middle to Late Pleistocene paleochannel of the Waikaia River in relation to historical placer gold mine sites. B, Sketch map of the migrating footprint of the active mine, drawn from an aerial photograph taken in August 2017. Generalised suspended sediment contents of mine waters are indicated. C, Photograph of the floating plant in active mine pond, being fed auriferous basal gravel (submerged) by excavator. Coarse tailings from plant are in the foreground.
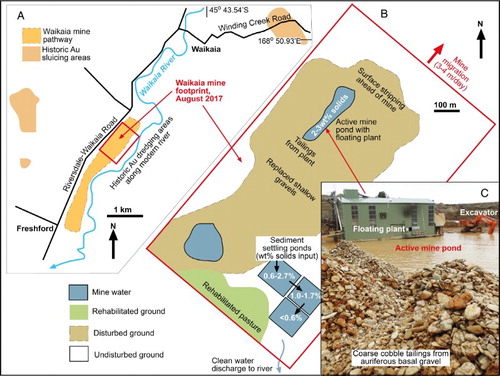
Figure 3. Stratigraphy and lithologies of the Waikaia placer gold mine. A, Generalised stratigraphic section through the auriferous paleochannel and underlying basement. B, Photograph of excavated wall of overburden gravels in the mine. C, Photograph of an upper portion of Middle to Late Pleistocene auriferous paleochannel gravel with iron oxyhydroxide staining (brown) and pale clay-altered greywacke clasts. Seeping groundwater has suspended clay. Yellow circles highlight rounded quartz pebbles recycled from Cenozoic quartz pebble conglomerates (B). D, Coarse cobbles from the basal auriferous paleochannel gravel, in mine tailings (C). Most clasts are greywacke, but rare silcrete and high-grade schist are indicated.
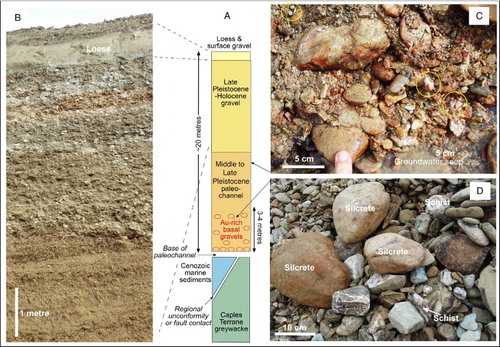
Figure 4. Detrital heavy minerals from the auriferous basal gravels of the Waikaia paleochannel. A, Hematite (Hem) and subordinate magnetite (Mt) form abundant black sand, with variably rounded and flattened gold particles. Round gold particle to right of centre has intergrown Fe oxyhydroxide (FeOx) and quartz. B, Small angular gold nugget with intergrown quartz, and accompanying hematite, zircon and spessartine garnet (Spess) heavy mineral suite. C, Cinnabar clast (HgS). D, Small angular gold nugget with gold crystal facets exposed, and intergrown clear quartz crystals. E–I, SEM backscatter electron images of gold particles showing the wide range of shape modification from subrounded (E) to folded and highly flattened (H,I).
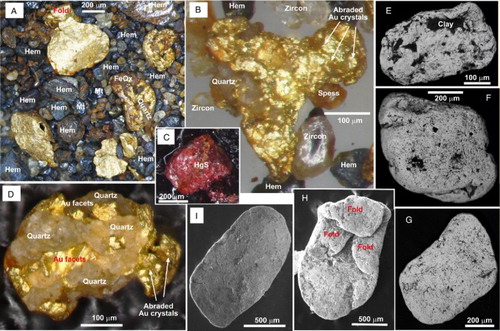
Figure 5. SEM electron backscatter images of authigenic gold overgrowths on gold particles from Waikaia placer mine. A, Clay-filled depression (dark grey) in abraded gold surface has abundant nanoparticulate gold overgrowths (white spots). B, Close view of the boundary between a clay-filled depression (left) and abraded gold surface (right), with nanoparticulate gold intergrown with clay, and crystalline gold overgrowths on the adjacent gold. C, D, Delicate intergrowths of clay and authigenic nanoparticulate gold and micron scale authigenic gold plates.
Figure 6. Internal structure of a subrounded gold particle from Waikaia placer mine, as exposed in a polished section etched with aqua regia. A, Incident light view of the particle, with contrasting flattened and folded flakes to right. B, Close incident light view of a portion of the particle, showing the textural contrast between core and rim displayed by differential etching. C, EBSD map of the internal grain structure of the particle. D, Close incident light view of a portion of the particle, showing the textural contrast between core and rim displayed by differential etching. White dotted line shows inner boundary of Ag-poor rim. E, EBSD map of the internal grain structure of a portion of the particle, showing contrast between core and rim grain size. Yellow dashed line is inner boundary of fine-grained rim, as also indicated in C and D.
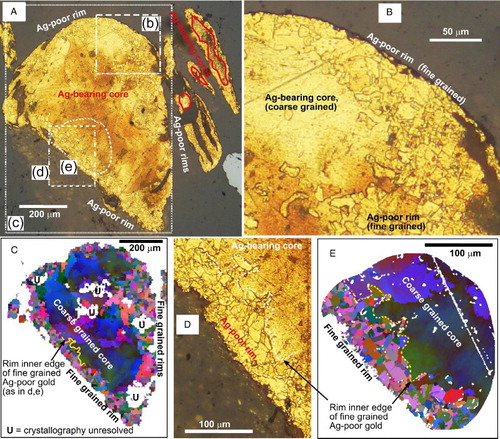
Figure 7. Images of contrasting grain size and texture of core and rim of weakly deformed gold particles from Waikaia placer mine. A, Incident light image of etched section of particles with large coarse-grained cores and narrow finer grained rims. B, Close view of portion of central particle in A, showing contrast in grain size highlighted with etching. C, EBSD image of the coarse internal grain structure of the same area as in B, with gradational colour changes showing the weak ductile deformation. D, EBSD map of a moderately flattened flake dominated by coarse grains and a thin fine-grained edge. E, Bar graph of crystallographic angular misorientation across grain boundaries along a longitudinal transect of the particle in D.
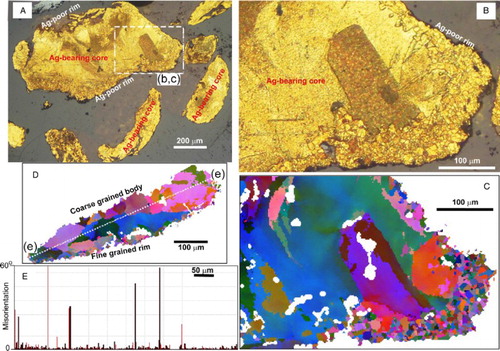
Figure 8. Grain structure of gold particles with well-developed fine-grained rims from Waikaia placer mine. A, Incident light view of etched section of a particle with a rim that has been partly folded. B, EBSD map of particle in A, showing the fine-grained rim structure. C, Bar graph of crystallographic angular misorientation across deformed coarse core grains along a longitudinal transect of the particle in B. D, Bar graph of misorientations across fine recrystallised grain boundaries along a transect of the rim of particle in B. E, EBSD map of a flattened flake with fine-grained rim. F–H, Bar graphs of crystallographic angular misorientations across grain boundaries along the transects indicated in E, contrasting core and rim grain textures.
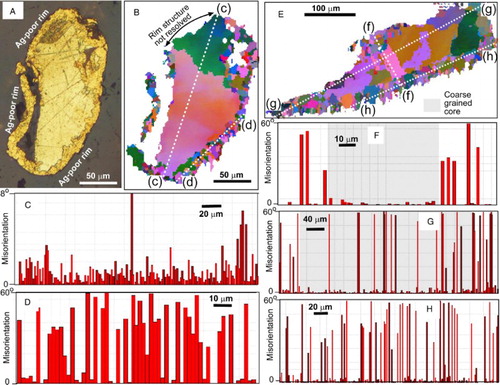
Figure 9. Internal structure of deformed gold grains with relict cores and well-developed rims. A, Incident light image of etched section showing some relict cores. B, EBSD map of a portion of large grain in a showing remnants of deformed core grains and recrystallised rim. C, D, Bar graphs of crystallographic angular misorientations in near-orthogonal transects across the particle in B. E, Incident light image of etched section of deformed particles. F, EBSD map of grain structure of large particle in E, showing almost complete recrystallisation of coarse deformed core grains to finer grained gold. G, Bar graph of misorientations of grains along the transect in F.
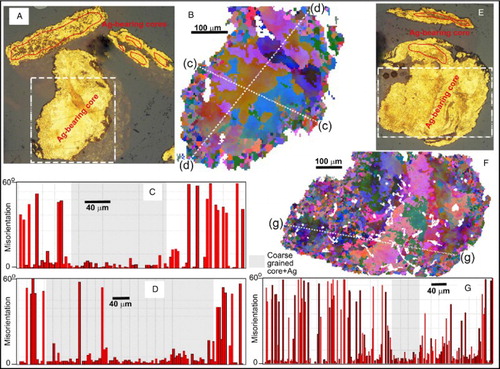
Figure 10. Fine sediments suspended in groundwater during the mining process and pumped from the active mine pond. A, Aerial view of a train of settling ponds built when the mine opened in 2014. Coarser particles dominate at the upstream end where different ponds were in different stages of operation. B–E, SEM secondary electron images of particles collected at the most upstream pond input from the active mine pond (B) in October 2017. White patches are artefacts in image as a result of charging where poor electrical connections result from incomplete carbon coating of irregular shapes during sample preparation. F, SEM image (as for D–E) of sediment collected from water within the most upstream pond.
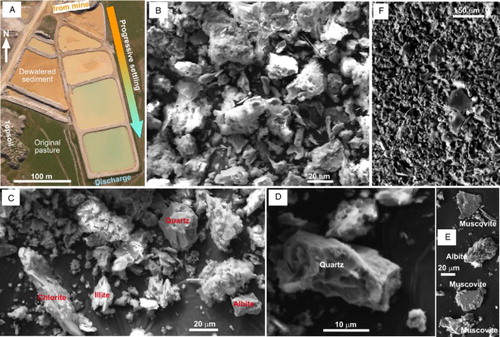
Figure 11. SEM secondary electron images and element maps of particles collected from water in the most downstream settling pond (B) in October 2017. A, Typical particle shapes and sizes. B, Wispy sulphate encrustation. C, Authigenic iron oxyhydroxide. D, Secondary electron image of particles, and associated silicon (Si), aluminium (Al), potassium (K), iron (Fe), sodium (Na) and calcium (Ca) element maps of the same area of sediments.
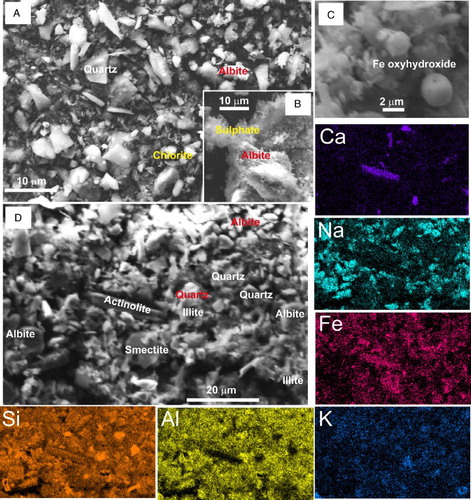
Table 1. Water analyses from the Waikaia placer mine.
Figure 12. Schematic summary of internal textural changes that have occurred in gold particles during and after transport-related deformation. A, Digitally processed EBSD map of a portion of a gold particle showing two original large core grains, with small rim grains superimposed on part of grain 1. Grain and subgrain boundaries have been highlighted, with contrasting amounts of lattice misorientation across them. B, Sketch of progressive changes in lattice misorientations with increasing deformation over time, along line X–Y in A. Initially undeformed large grains (red line) became weakly deformed large grains (blue line), then rims were recrystallised to finer grains (green line), and ultimately these became internally distorted as well.
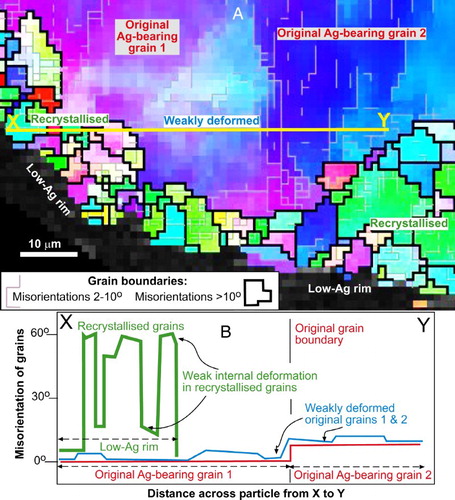
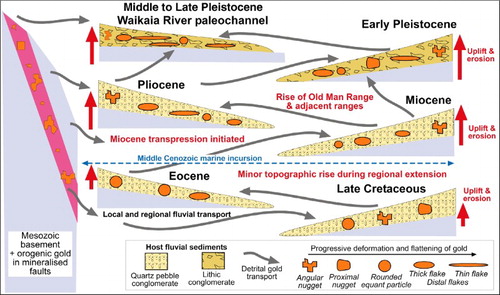
Figure 13. Cartoon summary of progressive accumulation of detrital gold via recycling of sediments and erosion of primary basement gold during long-term uplift in the region between Central Otago and Eastern Southland that became the Waikaia River catchment (B,D). The complex history yields co-existing detrital gold particles with diverse morphologies reflecting variable transport-related deformation histories in a small area.