Figures & data
Figure 1. Maps showing the location and setting of the Waitaki catchment. A , Generalised geological map with water sampling locations indicated with Station number. B , Location of the catchment in the South Island of New Zealand and line of section for C, idealised cross section showing the topography relative to the Alpine Fault, with the highest elevation in the Southern Alps corresponding to the location of the main divide (after Koons, Citation1990).
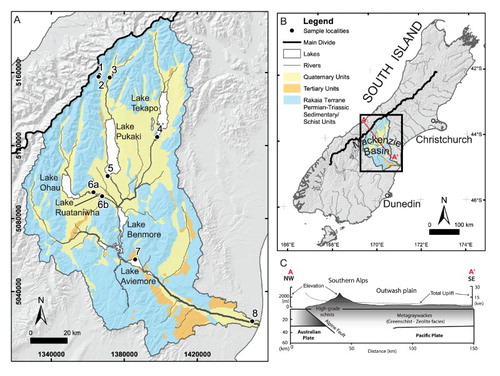
Figure 2. Schematic depiction of the hydrology of the Waitaki catchment. Water sampling locations are indicated with station numbers (after Pettinger, Citation2016).
Table 1. Analytical results for water and ice samples in the Waitaki Catchment. Station numbers correspond to locations in .
Table 2. Elemental and Sr isotope geochemistry of the acetic acid leach of terminal moraine and fault rocks in the Waitaki catchment.
Figure 3. Plot of total dissolved solids (mg/L) versus molar Na/(Na + Ca), showing a number of world rivers and other water bodies (after Gibbs, Citation1970). The field encircled in red indicates the Waitaki catchment waters from this study, with shading of circles becoming darker with decreasing distance from the mouth of the river. New Zealand rainwater values from Jacobson et al. (Citation2003).
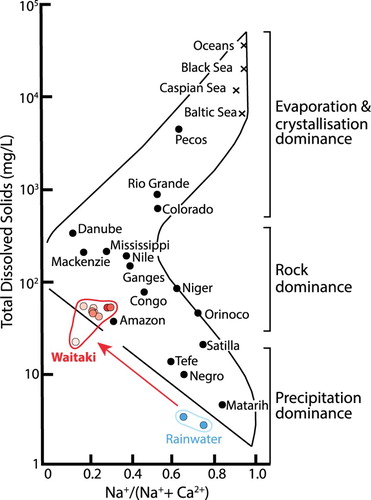
Figure 4. Plot of pH of water at the sample stations as a function of position in the catchment as distance from the Waitaki River mouth, keyed to the sampling season. Samples taken on the same date are connected by dashed lines.
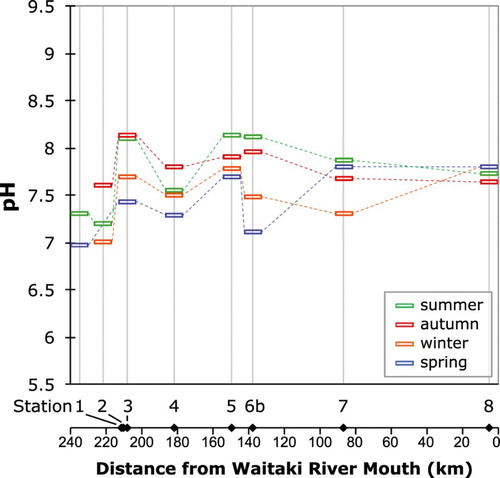
Figure 5. Downstream variation in freshwater composition. A–D, Major cations and E, Si concentrations at the sample stations plotted as a function of position in the catchment, keyed to the sampling season.
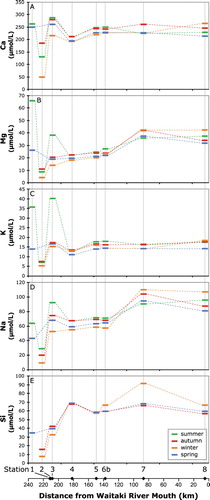
Figure 6. Plot of dissolved Ca concentrations (µmol/L) versus measured pH for stream waters in this study. Lines shown are calcite saturation curves for Ca concentration at indicated total dissolved carbonate species in the water. All the samples plot below the saturation curve even for the highest possible carbonate in the river water calculated for charge balance (as discussed in text).
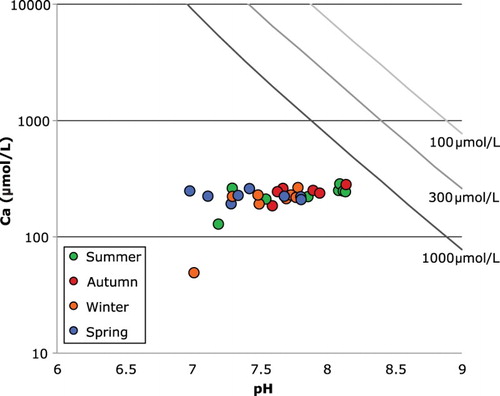
Figure 7. Downstream variation in freshwater Sr concentration and isotopic composition. A, Sr concentration and B, 87Sr/86Sr at the sample stations plotted as a function of position in the catchment, keyed to the sampling season.
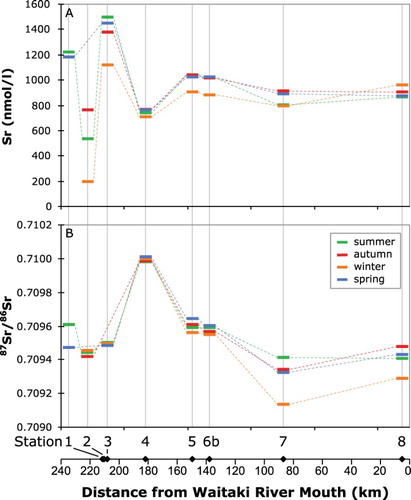
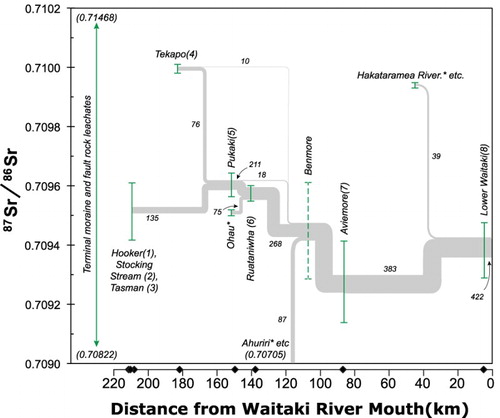
Figure 8. Plot showing the mass balance for Sr isotopic composition (87Sr/86Sr) in waters at each location in the Waitaki catchment. The range of 87Sr/86Sr measured at each sampling station is plotted as a function of its distance from the mouth of the Waitaki River (as in B), except that the 87Sr/86Sr for Stations 1–3 are combined. Curves are labelled with the yearly average water fluxes (in m3/s) (from Table S1). Inferred values for locations where samples were not collected are in italics. The range of 87Sr/86Sr in leachates of rocks from the terminal moraine and the fault zones are indicated by the vertical line to the left of the samples, but note that the values are beyond the limits of the comparatively restricted range in the water samples.