Figures & data
Figure 1. A, Terrane map of South Island of New Zealand showing Otago Schist in central Otago; box shows location of . B, Northeast–southwest cross section showing overall structure of Mesozoic subduction system that formed Otago Schist; Waihemo Fault (WF) and Footwall Fault (FF) shown schematically. Inset, Zealandia with North (NI) and South Island (SI) of New Zealand and New Caledonia (NC).
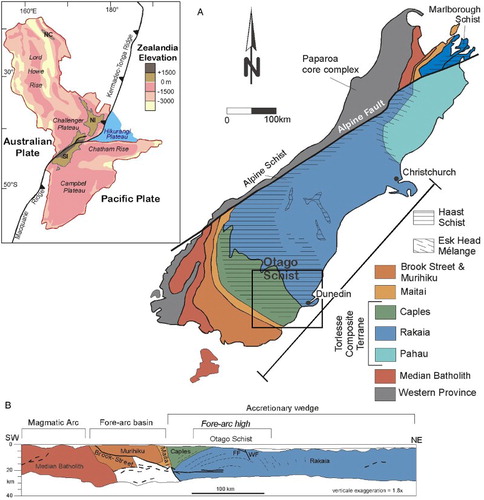
Figure 2. Tectonic map of Otago Schist and adjacent terranes showing metamorphic facies zones. Also shown Footwall and Waihemo faults, other Cretaceous normal faults and Cretaceous syn-rift deposits; note that Waihemo Fault cuts metamorphic zonation. Waipounamu Erosion Surface is part Late Cretaceous to Pliocene cover. Box outlines location of .
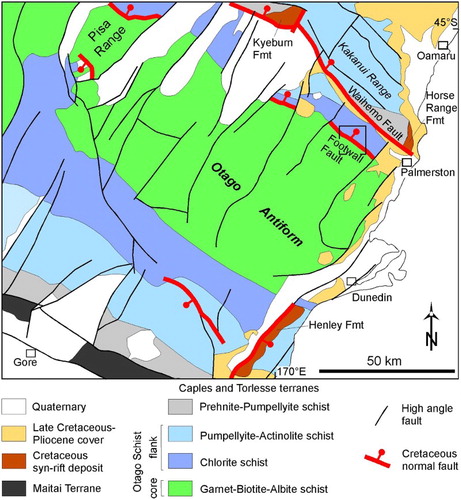
Figure 3. Simplified geological map of Deepdell Creek and adjacent Macraes gold mine (based on Bleakley and Yeo Citation1997; Forsyth Citation2001). Summary of structural measurements along Deepdell Creek transect, locations of photographs shown in , , and and localities of zircon fission-track (ZFT) samples H6, F3-5, F8 and F10 shown. Note that Hyde-Macraes Shear Zone varies considerably in thickness and gets very thin in Deepdell Creek transect.
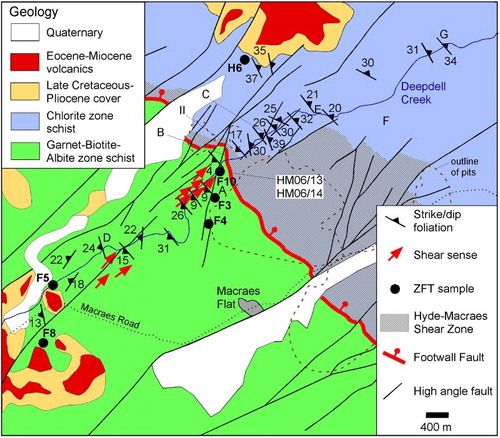
Figure 4. Stereographic projections of structural data. Foot- and hanging wall relative to Footwall Fault.
Figure 5. Structures in footwall of Footwall Fault. A, Footwall schist c. 150 m below Footwall Fault. Shear bands (marked by half arrows) and S-folds (arrow) provide consistent top-to-the-northeast shear sense; loaclity B. B, Brittle-ductile top-to-the-northeast displacing low-angle shear zones northeast of Deepdell settlement; locality D. C, Prominent normal fault c. 400 m below Footwall Fault with well-developed gouge layers; note two small-scale, subparallel normal faults to southwest; locality A. D, Array of high-angle normal faults c. 50 m below Footwall Fault; locality C. In B–D, normal faults highlighted by half arrows. Refer to for localities.
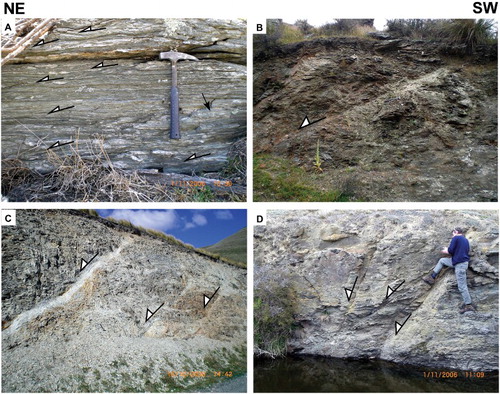
Figure 6. Photographs of footwall microstructures indicating top-to-the-northeast shear sense. A, Sample HM06/13 showing prominent c. 45°-dipping shear band (large red arrow) cutting through penetrative foliation; quartz dynamically recrystallises in shear-band structure; more small-scale shear bands (small red arrows with open arrowheads) formed in other parts of thin section and cut by c. 45°-dipping shear band; scale bar 1 mm. B, Shear bands in micaceous schist with thick quartz vein, sample HM06/14-2; note dynamic recrystallisation in shear bands; larger quartz crystals show subgrain development and deformed by shear bands; note S-C fabric in mica-rich parts of photo (full arrows); only few shear bands highlighted; scale bar 500 µm. C, Shear bands in quartz laminae and S-C fabrics in muscovite-rich layers; sample HM06/14-3; note that quartz shows grain-size reduction by recrystallisation in shear band. Mica-rich sections at bottom of thin section shows older crenulation cleavage (yellow arrow) deformed by shear band cleavage; red arrows as in B; scale bar 1 mm. D, Similar shear band structures as in A, quartz grain-size reduction and old crenulation cleavage as in C; sample HM06/14-3; arrows as in C; scale bar 1 mm. For sample locations refer to .
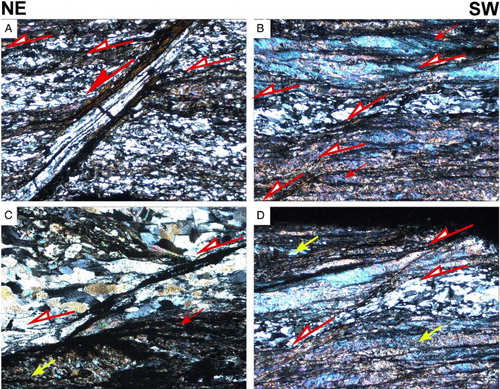
Figure 7. Fault-slip analysis below the Footwall Fault; diagram shows great circle of fault plane and projected trace of slickenside lineation in lower-hemisphere equal-area projection; principal strain axes (X > Y > Z) shown, deduced extension direction (X) are indicated by hatched diverging arrows.
Figure 8. Structures in intra-shear schist (i.e. Hyde-Macraes Shear Zone). A, Subhorizontal brittle shear zone with high angle normal faults mainly above subhorizontal shear zone; relative displacement marked by red arrows showing top-to-the-north shearing. B, Similar structure as in A with less abundant high angle normal faults. C, Steeply northwest-dipping c. 40 cm thick normal fault. All photographs from locality II in .
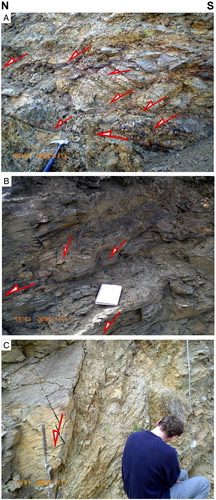
Figure 9. Structures in hanging wall of Footwall Fault. A, Southwest-verging fold associated with northwest-dipping axial planes (dashed red lines); outcrop C. B, Kink bands with steeply dipping axial planes; kink axes on foliation planes marked by ‘corrugations’ (red arrows); outcrop F. C, Northeast-dipping normal fault with associated Riedel shears (yellow arrows); outcrop G. D, Northeast-dipping normal fault truncating foliation; outcrop E. Refer to for locations of outcrops.
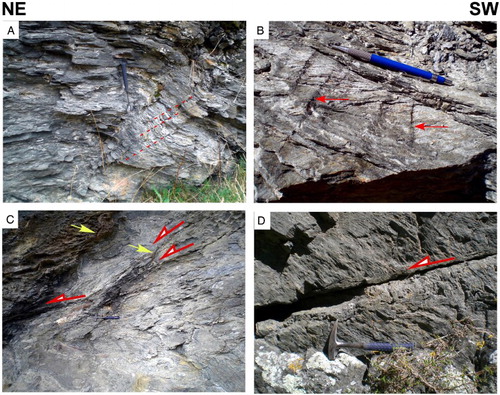
Figure 10. Fault-slip analysis in hanging wall of Footwall Fault. Data set mainly composed of southwest- and northeast-dipping normal faults with few cross faults.
Table 1. Erosion rate, fission track age, closure depth, temperature and cooling rate as function of thermal gradient calculated with 1D thermal advection model Age2edot.
Figure 11. Radial plots of five footwall and one hanging wall sample from Hyde-Macraes Shear Zone. Plots made with Radial Plotter program of Vermeesch (Citation2009).
Table 2. Zircon fission-track ages.
Figure 12. A, Position of zircon fission-track (ZFT) samples with respect to elevation and distance to Footwall Fault; ZFT ages given as central ages with 2σ uncertainties; note small elevation difference between samples. B, Relationship between ZFT age and exhumation rate for three thermal gradients (15, 20 and 25 °C/km) calculated, thermal parameter input for 1D thermal advection model Age2edot of Brandon (see Ehlers et al. Citation2005) kept constant; stippled lines indicate maximum and minimum exhumation rate depending on zircon fission track age and assumed thermal gradient; average long-term exhumation rates c. 0.2 ± 0.1 km/Ma.
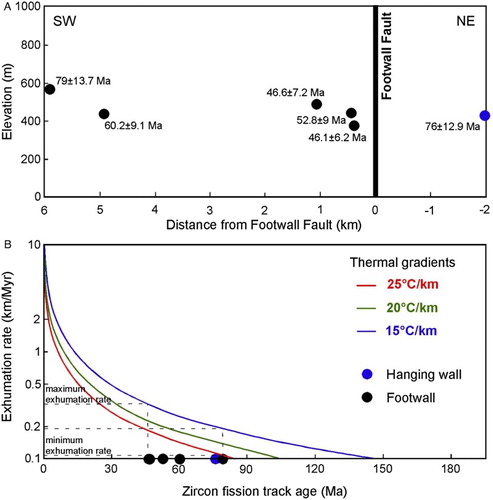
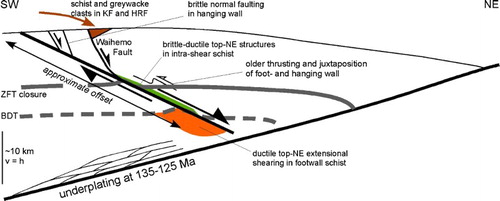
Figure 13. Tectonic interpretation for Footwall Fault, see text for explanation. Broad temperature constraints on deformation structures suggest footwall cooling during exhumation of > 200 °C; assumed 20 °C/km thermal gradient results in > 10 km throw, translating into > 20 km of displacement for 30° dipping Footwall Fault. ZFT closure, approximate closure depth for zircon fission tracks; BDT, brittle–ductile transition; KF, Kyeburn Formation; HRF, Horse Range Formation (KF and HRF part of the Momotu Supergroup).