Figures & data
Figure 1. A, Pacific–Australian plate boundary through central New Zealand. B, Crustal (black) and subduction interface (red) fault sources in the NSHM (Stirling et al. Citation2012). C, Fault structure of the Wellington Harbour/Te Whanganui a Tara and surroundings (modified from 1:50 000 map; Begg and Mazengarb Citation1996). Major active faults are shown as thick red lines. Faults considered likely to be active are red dashed lines. Other faults are shown as thinner black lines. Yellow lines are fault sources in the NSHM (Stirling et al. Citation2012). Fault labels include: SGF, Shepherd’s Gully Fault, WVF, Whitemans Valley Fault, MTRF, Moonshine-Takapu Road Fault, KF, Khandallah Fault, LF, Lambton Fault, TF, Terrace Fault, HVF, Happy Valley Fault, EBF, Evans Bay Fault, SF, Seatoun Fault, PGF, Point Gibson Fault; PDF, Point Dorset Fault; EHF, East Harbour Fault. Note (1) the MTRF was considered active by Litchfield et al. (Citation2013), (2) the PGF and PDF were considered active by Huber (Citation1992), and (3) the fine black trace of the EBF is from Huber (Citation1992). Geographic locations: LH, Lambton Harbour, LB, Lyall Bay, M, Miramar Peninsula/Te Motu Kairangi, N, Ngauranga, IB, Island Bay, MV, Mount Victoria/Matairangi, MA, Mount Albert, RR, Rimutaka/Remutaka Range, SMI, Matiu/Somes Island, HR, Hutt River/Te Awakairangi.
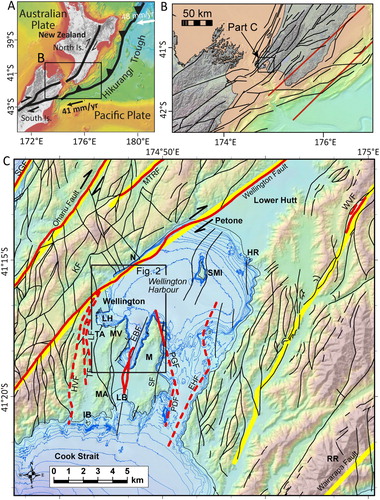
Figure 2. Boomer seismic lines acquired in the south western part of Wellington Harbour during IKA1012 (2010) and IKA1303 (2013) surveys. White lines show the extent of the IKA1303 survey, while the red lines indicate data collected during IKA1012 survey. The locations of the Kaiwharawhara-1 and Tangaroa TAN1103-WF sediment cores are shown by the white and yellow dots, respectively. Boreholes SB1 and SB2 in Evans Bay are shown by white dots. KS, Kaiwharawhara Stream; TPT, Te Papa Tongarewa (Museum of New Zealand), WA, Wellington Airport. Fine blue lines are 2 m bathymetric contours (m).
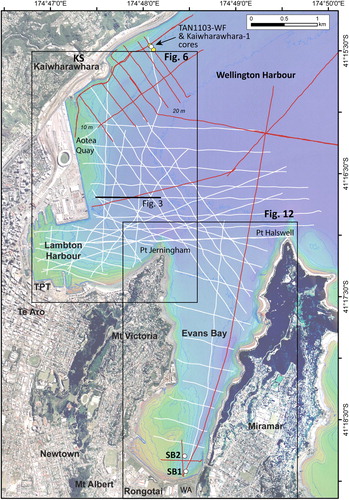
Figure 3. Seismic reflection profile from the outer part of Lambton Harbour, showing prominent reflections and seismic units deformed by the Aotea Fault. Boomer profile IKA1303-104. Refer to for line location. M denotes the seabed multiple.
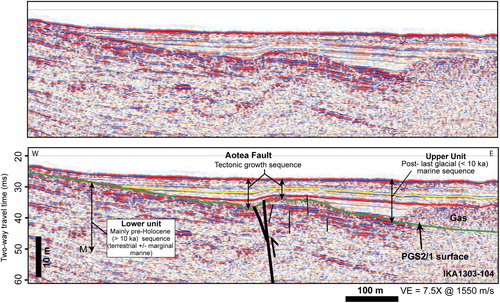
Figure 4. Seismic reflection profile IKA1012-003, showing location of sediment cores collected on either side of the Wellington Fault, offshore of Kaiwharawhara. A, IKA1012 boomer lines (in red), including profile IKA1012-003 (thick red line), IKA1303 profiles in white, and previous New Zealand Oceanographic Institute archived analogue survey data (in black) (Lewis Citation1989). Thick black line labelled WnF is the Wellington Fault, modified from Lewis (Citation1989). Kaiwharawhara-1 core, white dot; TAN1103-WF cores, yellow dots. B, Detail of profile IKA1012-003, showing sediment cores, with radiocarbon ages in calibrated years BP and interpreted reflections (green (PGS2/1), red and yellow). C. Profile IKA1012-003, showing interpreted upper and lower seismic units and key reflections (green (PGS2/1), red and yellow), sediment cores, and the Wellington Fault. The vertical scale bar and the depth-to-time conversion of sediment cores assumes a p-wave velocity in sediments of 1550 m/s.
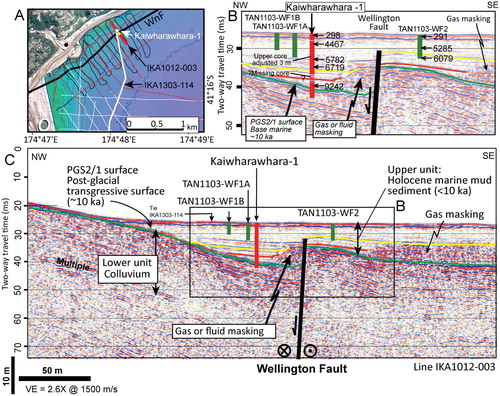
Table 1. Sediment cores located offshore of Kaiwharawhara, Wellington Harbour.
Figure 5. A, Lithologic log for the Kaiwharawhara-1 sediment core, with calibrated radiocarbon dates (median ± 2 sigma error). Note that the logged depths are shown here with a static shift of 3 m upwards to account for an apparent correction required to the upper sections of the core (see Supplementary Material, Figure S7). The precise depth of the lower section of the core below 7.8 m (here coloured), however, appears from the seismic sections to be too high by as much as 2 m when the static shift is applied to the entire core. This indicates uncertainty in the precise position of the lower section of the core below 7.8 m. The interpreted positions of the green PGS2/1, red and yellow reflections are indicated. B, Lithologic logs for cores TAN1103-WF1A, TAN1103-WF1B, and TAN1103-WF2, showing calibrated radiocarbon ages (median ± 2 sigma error). C, X-radiographs of Kaiwharawhara-1 core, midway down box sections 3 and 5. The darker tones indicate less dense material. Bioturbation has likely caused the mottling visible at the top and bottom of the X-radiograph of box section 3C. Shells and shell fragments are apparent as white shapes, including a large turret shell in the lower panel. The seismic reflections in the upper seismic unit must result from subtle variability in density and/or p-wave velocity. The scale bar down the left of the core shows 5 cm increments. D, Composite magnetic susceptibility (Mag sus SI) results from all cores, here showing the static shift applied to the entire Kaiwharawhara-1 core (see Supplementary Material, Figure S7).
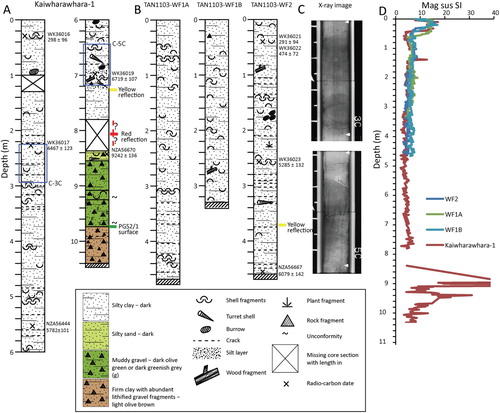
Figure 6. Active traces of the Aotea Fault mapped beneath Wellington Harbour. The trace of the offshore Wellington Fault is modified from Lewis (Citation1989). Thick black lines shown on land are faults from the GNS Science 1:50 000 database; red dashed lines are inferred faults thought likely to be active (e.g. Begg and Mazengarb Citation1996). Blue lines with labels are bathymetric contours. The pinch-out of the upper seismic unit mapped in the harbour is depicted by the black dashed line near the coastline. Note the precise position of the unit’s pinch-out beneath Chaffers Marina and Te Papa Tongarewa (Museum of New Zealand; TPT) and east of Oriental Bay is not certain. Marine sediments of probable Holocene age are present beneath reclamation fill, at about 10 m depth in boreholes at TPT (Semmens Citation2010). The outline of subsurface gas masking extent is shown as a purple mask on the right-hand side of the figure. Thin black lines and white italicised labels show the boomer profile locations associated with the IKA1303 survey (see also ), unless specified. White lines indicate profiles illustrated in , and . Black circles along the Aotea Fault trace show the positions of profiles analysed in . CQW = Clyde Quay Wharf.
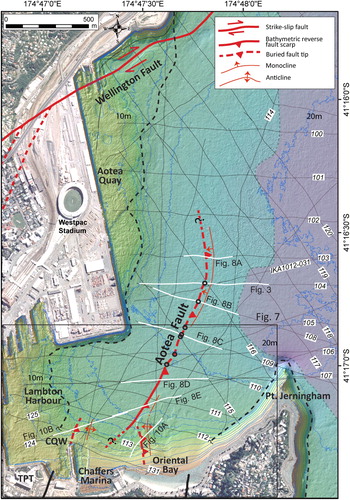
Figure 7. A, Detailed map of the southern, nearshore traces of the Aotea Fault. The inner edge of mud deposition associated with the upper seismic unit is depicted as a thin dashed white line. Thin black lines show the boomer profile locations from the IKA1303 survey. Yellow lines highlight profiles illustrated in and . Seafloor scarp heights (m) along the Aotea Fault are shown in brackets. Thin red lines on land are faults from the GNS Science 1:50 000 database (e.g. Begg and Mazengarb Citation1996). TPT = Te Papa Tongarewa (Museum of New Zealand), WP = Waitangi Park, FSP = Freyberg Swimming Pool; B, West to east bathymetric profile (X-X’) across the Aotea Fault, showing 1 m seabed scarp.
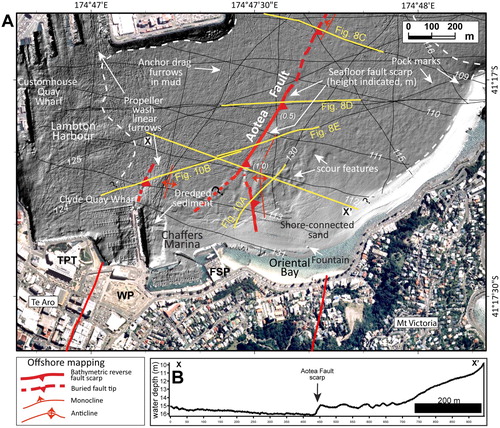
Figure 8. Examples of boomer seismic reflection profiles across the Aotea Fault. See and for locations, and the Supplementary Material Figure S4 for un-interpreted sections. M denotes the seabed multiple.
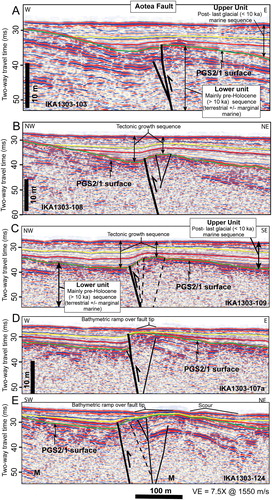
Figure 9. A, Plot of vertical separation measured for different reflections along the strike of the Aotea Fault. Errors bars are ± 25%. In addition, estimates of maximum and minimum separations for some horizons are indicated on particular sections where the individual curves diverge. The blue line shows the seafloor offset, and the yellow, red and green lines indicate the offsets on the yellow, red and PGS2/1 horizons, respectively. B, Corresponding along-strike vertical separation rates on the Aotea Fault. Errors estimated are based on separation uncertainties of ± 25%, and the various reflector age uncertainties of ± 400 years (yellow reflector), ± 1460 years (red reflector), and ± 1500 years (PGS2/1), respectively. All lines numbered are from survey IKA1303 unless otherwise stated.
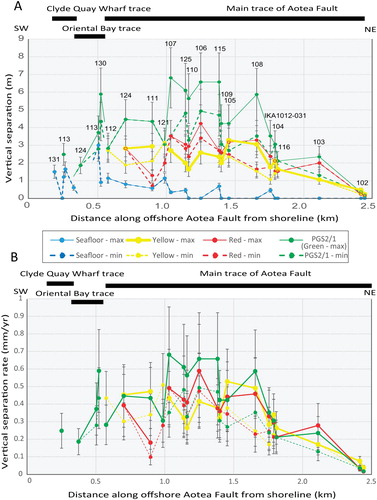
Figure 10. Boomer seismic reflection profiles across the Oriental Bay (A) and Clyde Quay Wharf traces (B) of the Aotea Fault. In both sections the fault is interpreted where asymmetrically folded hanging wall and footwall reflections appear to be cut off. The dashed line type in B reflects relatively increased uncertainty in the precise position of the fault plane. See for locations, and the Supplementary Material Figure S4 for un-interpreted sections. M denotes the seabed multiple.
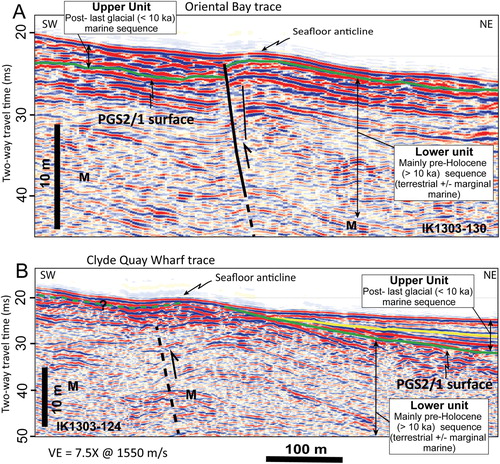
Figure 11. Separation-time curves for reflections correlated across the Aotea Fault. Cumulative vertical offsets (m) of each reflection are calculated from their depth in the footwall minus their depth in the hanging wall. The inset shows the complete interval of time since development of the PGS2/1 surface, whereas the enlarged plot shows details of the primary growth intervals. Errors are estimated to be a standard value of ± 25% on all separation measurements. Uncertainties in ages vary down section, pinned by the assigned values of ± 400 years (yellow reflector), ± 1460 years (red reflector) and ± 1500 years (green reflector), respectively. Black circles around coloured symbols indicate specific recognisable displacement events (EQ1, EQ1b? and EQ2). The kilometre scale indicated in the dashed box on the right is the position of each profile along the strike of the fault from the shoreline at Chaffers Marina. Profiles used in the analysis are delineated by the ‘L’ notation, with profile positions shown as black circles in .
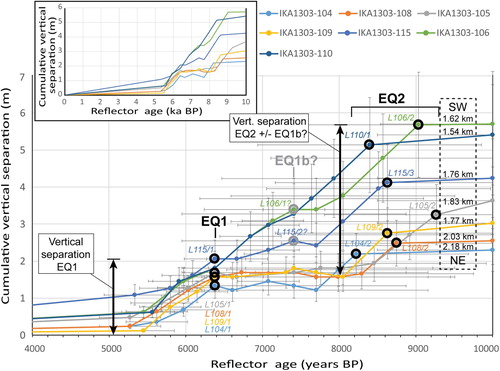
Figure 12. Map of the active Evans Bay Fault. The inner edge of mud deposition associated with the upper seismic unit is depicted as the dashed black line. The extent of subsurface gas masking in the northern part of the bay is represented by the purple mask in the north of Evans Bay. Blue lines with labels are bathymetric contours. Boreholes SB1 and SB2 in southern Evans Bay are shown as white dots. Thin black lines and white italicised labels show the boomer profile locations associated with the IKA1303 survey (see also ), unless specified. Thin white dashed lines are older profiles presented by Lewis and Mildenhall (Citation1985). White lines indicate profiles illustrated in . The onshore extension of the Evans Bay Fault in Rongotai (bold red, including line labelled B&M) is modified from Begg and Mazengarb (Citation1996). For comparison with our results, the thin red dashed line with label LC&LM was the inferred active trace of the Evans Bay Fault as mapped by Lewis and Carter (Citation1976) and Lewis and Mildenhall (Citation1985). WA, Wellington Airport.
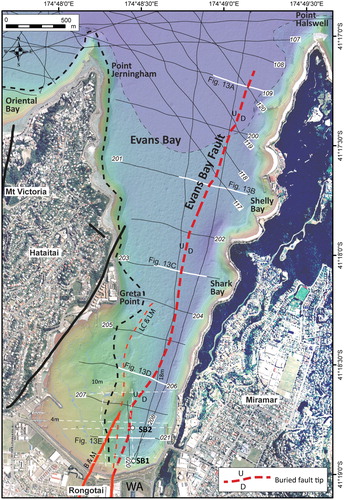
Figure 13. Boomer seismic profiles across the Evan Bay Fault, Wellington Harbour. Refer to for line locations. The bold black line is the primary trace of the fault, dashed where inferred. Coloured reflections are as on , , and . M denotes the seabed multiple. Part E displays the lithological log of borehole SB2 (Lewis and Mildenhall Citation1985), as defined by (1) mud, (2) laminated sandy mud, (3) carbonaceous muds, sands and gravels, (4) peat, and (5) shelly sands. Label 10350 alongside the log is a radiocarbon age (yr BP) from Lewis and Mildenhall (Citation1985).
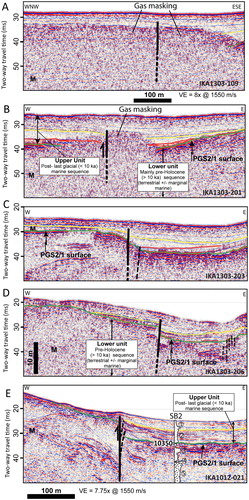
Figure 14. A, Plot of vertical separation measured for different reflections along the strike of the Evans Bay Fault. Errors bars are ± 25%. In addition, estimates of maximum and minimum separations for some horizons are indicated on particular sections where the individual curves diverge. B, Corresponding along-strike vertical separation rates on the Evans Bay Fault. Errors estimated are based on separation uncertainties of ± 25%, and the various reflection age uncertainties of ± 400 years (yellow reflection), ± 1460 years (red reflection) and ± 1500 years (green, PGS2/1), respectively. Lines 020 and 021 are from IKA1012 survey. All other lines are from survey IKA1303 (see for profile locations).
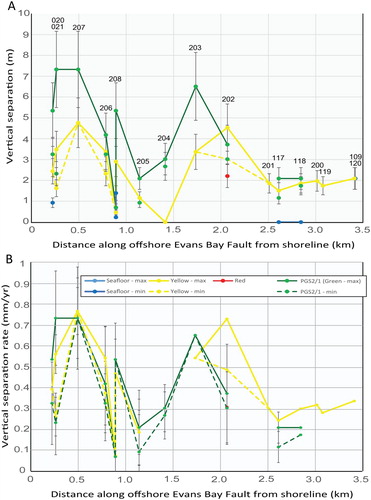
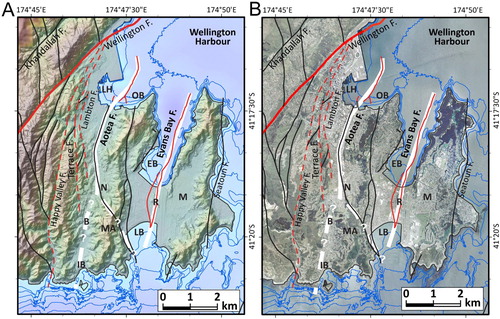
Figure 15. Major crustal faults in the Wellington region modified from Begg and Mazengarb (Citation1996), overlain onto topography and bathymetry (A) and ortho-photography (courtesy of Land Information New Zealand) (B). Red solid lines denote faults that are demonstrably active; red dashed faults were considered by Begg and Mazengarb (Citation1996) to likely be active. Other faults with uncertain activity are shown in black. Bold white lines indicate the inferred crustal extents of the active Aotea and Evans Bay faults, including their possible southern onshore extensions. The inferred southern extension of the Aotea Fault to the south coast at Lyall Bay (LB) (dashed white line) is from Begg and Mazengarb (Citation1996). A possible alternative extension south to Island Bay (IB) is proposed here. The inferred southern extension of the Evans Bay Fault onshore is from Stevens (Citation1990), Lewis and Carter (Citation1976), Huber (Citation1992), Pillans and Huber (Citation1995) and Begg and Mazengarb (Citation1996). Geographic locations: LH, Lambton Harbour; OB, Oriental Bay; EB, Evans Bay; M, Miramar; N, Newtown; MA, Mount Albert; B, Berhampore; R, Rongotai.