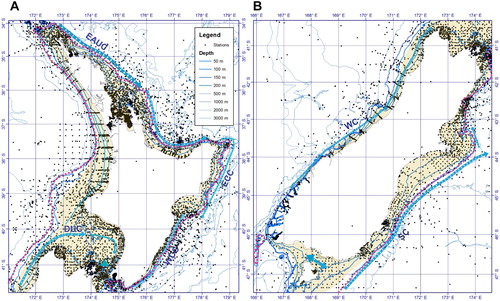
Figure 1. (A) Bathymetric map of the New Zealand region. The isobaths are at 150 m, 500 m, 1,000 m, 2,000 m, 3,000 m and 4,000 m. The main bathymetric features mentioned in the text are labelled. Abbreviated locations are: C Is. – Campbell Island/Motu Ihupuku, B Is. – Bounty Islands, A Is. – Auckland Islands, Ch Is. – Chatham Island, An Is. – Antipodes Islands, M Is. – Macquarie Island, CS – Cristable Seamount, BS – Bollons Seamount, HC – Hokitika Canyon, PT – Puysegur Trench, OC – Otago Canyons, MS – Mernoo Saddle, TVZ – Taupo Volcanic Zone, STF – Subtropical Front, ACC – Antarctic Circumpolar Current, DWBC – Deep Western Boundary Current. The area shaded in orange (depths >4000 m) is the below the CCD (carbonate compensation depth; Bostock et al., Citation2011). (B) Location of all the stations used in this study, within and just beyond the New Zealand’s Exclusive Economic Zone (EEZ) and outer limit of the Extended Continental Shelf (OLECS).
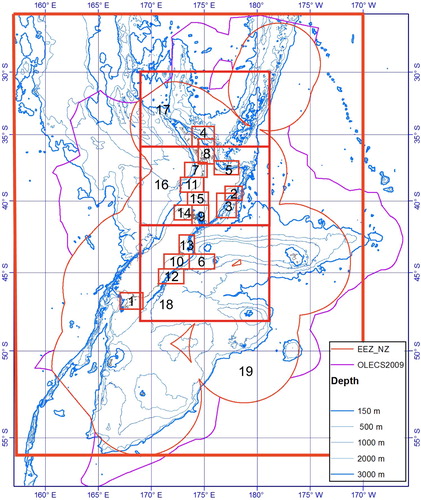
Figure 2. Location of previous sediment maps for the New Zealand region ().
Table 1. Published sediment charts of New Zealand (see for the locations of these charts).
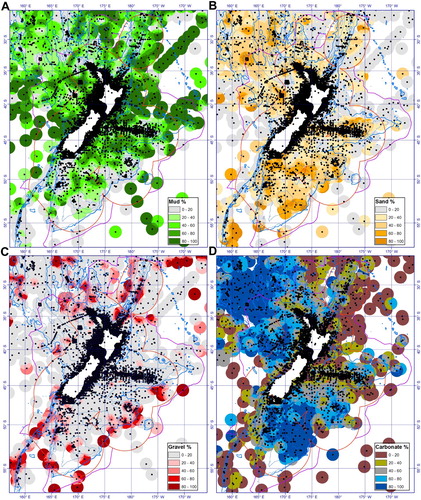
Figure 3. (A) Mud % interpolated across the EEZ and OLECS of New Zealand. (B) Sand %, (C) Gravel %, (D) Carbonate %. Using Kriging method in ArcGIS with a maximum range of 100 km. We have used the dbSEABED colour legends for the representation of the different sediment properties (http://instaar.colorado.edu/~jenkinsc/dbseabed/helpful/index.html).
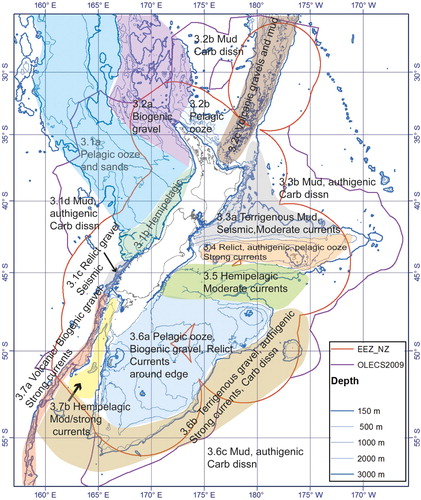
Figure 4. The main sedimentary regions and their predominant sediment types and influences (see for more details).
Table 2. Characterisation of the continental slope and basins around New Zealand.
Bostock HC, Hayward BW, Neil HL, Currie KI, Dunbar GB. 2011. Deep-water carbonate concentrations in the southwest Pacific. Deep-Sea Research I. 58:72–85.
Cullen DJ, Gibb JG. 1965. Foveaux coastal sediments chart (1: 200,000). Wellington, New Zealand: New Zealand Oceanographic Institute, Department of Scientific and Industrial Research.
Pantin HM, Gibb JG. 1968. Mahia coastal sediments chart (1:200,000). Wellington, New Zealand: New Zealand Oceanographic Institute (now NIWA), Department of Scientific and Industrial Research.
Lewis KB, Gibb JG. 1970. Turnagain coastal sediments chart (1: 200,000). Wellington, New Zealand: New Zealand Oceanographic Institute, Department of Scientific and Industrial Research.
Eade JV. 1974. Poor Knights coastal sediments chart (1: 200,000). Wellington, New Zealand: New Zealand Oceanographic Institute, Department of Scientific and Industrial Research.
Doyle AC, Carter L, Glasby GP, Lewis KB. 1979. Bay of Plenty coastal sediments chart (1: 200,000). Wellington, New Zealand: New Zealand Oceanographic Institute, Department of Scientific and Industrial Research.
Herzer RH. 1979b. Banks coastal sediments chart (1: 200,000). Wellington, New Zealand: New Zealand Oceanographic Institute, Department of Scientific and Industrial Research.
Doyle AC, Arron ES. 1982. Raglan coastal sediments chart (1: 200,000). Wellington, New Zealand: New Zealand Oceanographic Institute, Department of Scientific and Industrial Research.
Carter L, Eade JV. 1980. Hauraki coastal sediments chart (1: 200,000). Wellington, New Zealand: New Zealand Oceanographic Institute, Department of Scientific and Industrial Research.
Lewis KB, Mitchell JS. 1980. Cook Strait coastal sediments chart (1: 200,000). Wellington, New Zealand: New Zealand Oceanographic Institute, Department of Scientific and Industrial Research.
Herzer RH. 1981. Ellesmere Coastal Sediments chart (1: 200 000). New Zealand Oceanographic Institute, Department of Scientific and Industrial Research, Wellington, New Zealand.
Arron ES, Doyle AC. 1983. Mokau coastal sediments chart (1: 200,000). Wellington, New Zealand: New Zealand Oceanographic Institute, Department of Scientific and Industrial Research.
Arron ES. 1986. Oamaru coastal sediments chart (1: 200,000). Wellington, New Zealand: New Zealand Oceanographic Institute, Department of Scientific and Industrial Research.
Carter L, Herzer RH. 1986. Pegasus coastal sediments chart (1: 200,000), 2nd ed. Wellington, New Zealand: New Zealand Oceanographic Institute, Department of Scientific and Industrial Research.
Mitchell JS. 1987. Tasman coastal sediments chart (1: 200,000). Wellington, New Zealand: New Zealand Oceanographic Institute (now NIWA), Department of Scientific and Industrial Research.
Nodder SD, Edwards NA, Burrows MW. 1992. Patea coastal sediments chart (1: 200,000), 2nd ed. Wellington, New Zealand: New Zealand Oceanographic Institute (now NIWA), Department of Scientific and Industrial Research.
McDougall JC. 1975. Cook oceanic sediments chart (1:1,000,000). Wellington, New Zealand: New Zealand Oceanographic Institute (now NIWA), Department of Scientific and Industrial Research.
McDougall JC. 1979. Three Kings oceanic sediments chart (1: 1,000,000). Wellington, New Zealand: New Zealand Oceanographic Institute (now NIWA), Department of Scientific and Industrial Research.
McDougall JC. 1982. Bounty oceanic sediments chart (1:1,000,000). Wellington, New Zealand: New Zealand Oceanographic Institute (now NIWA), Department of Scientific and Industrial Research.
Mitchell JS, Carter L, McDougall JC. 1989. New Zealand regional sediments (1:6,000,000). Wellington, New Zealand: New Zealand Oceanographic Institute (now NIWA), Department of Scientific and Industrial Research. NZOI Miscellaneous Chart Series 67.
If you are unable to obtain permissions via Rightslink, please complete and submit this Permissions form. For more information, please visit our Permissions help page.
