Figures & data
Figure 1. A, Satellite gravity map of the South Island of New Zealand showing some features discussed in the text. B, A simplified geological map of Fiordland (after Turnbull et al. Citation2010) summarising features discussed in the text.
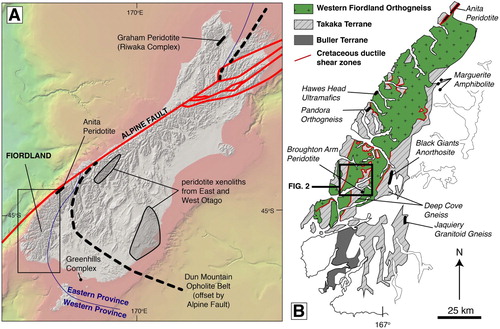
Figure 2. A, Geological map of the Broughton Arm area. B, Aerial photograph of Broughton Arm Peridotite looking to the southeast.
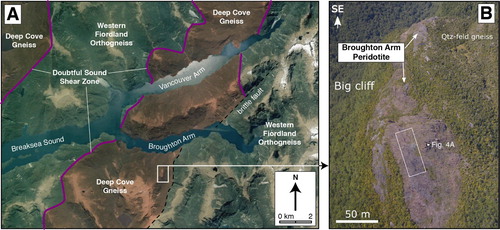
Figure 3. Geological map of the Broughton Arm Peridotite, associated rocks, and sample locations. The quartzofeldspathic gneisses samples for zircon U-Pb are from slightly southwest of the area. This map corresponds to the field of view in .
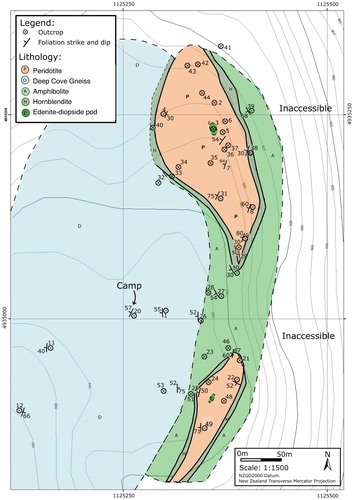
Figure 4. A, The Broughton Arm Peridotite is a distinctly orange-red body enclosing zoned patches of edenite-clinopyroxenite. The mountains in the background are Western Fiordland Orthogneiss and Broughton Arm fjord is present in the left hand side. See B for location of photograph. Hand specimens of the peridotite illustrate the variation in textural types from foliated and massive peridotite (B) to mylonitic peridotite (C).
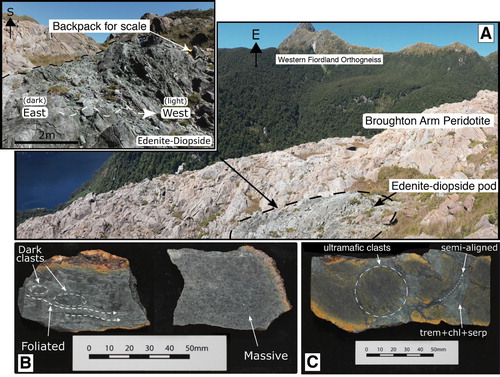
Figure 5. A, and B, show cross-polarised light microscopic images of the anhydrous (BP5A, BP40B) and hydrous (B, BP22A) peridotites. C, Backscattered electron image clearly show the replacement of olivine by chlorite, serpentine and magnetite (BP24A). D, Cross-polarised image of a mylonitic quartzofeldspathic gneiss (BP1A).
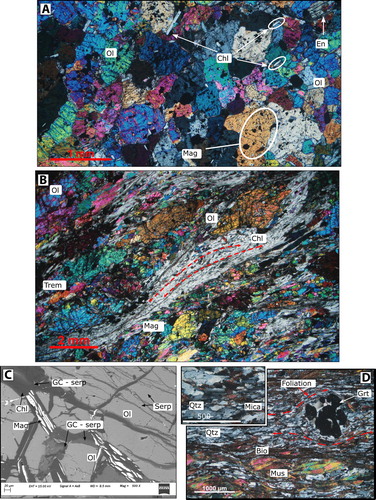
Table 1. Electron microbeam analytical data.*
Table 2. Whole rock X-ray fluorescence data.
Figure 6. A, Zircon U-Pb ages plotted on a concordia plot show the occurrence of c. 580 and 1100 Ma detrital populations. Note that three samples are plotted together. B, A discordia array enables calculation of a 105.6 ± 6.8 Ma population from titanite (n = 34 individual grains). Solid ellipses are data used to calculate the Cretaceous population and dashed ellipses are the remaining data. C, A plane polarised light microscopic image showing the distribution of titanite in BP18A.
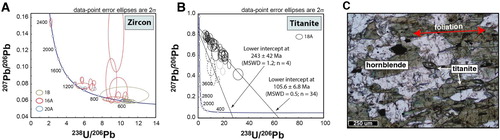
Figure 7. Comparison of bulk rock properties of the Broughton Arm Peridotite with global mantle xenoliths (Pearson et al. Citation2014), Anita Peridotite (Czertowicz, Scott, Waight, et al. Citation2016), peridotite at the base of the Dun Mountain Ophiolite Belt (Stewart et al. Citation2016; Scott unpublished data), Greenhills Complex (Spandler et al. Citation2003), Hawes Head Ultramafics peridotite (Daczko et al. Citation2012) and Graham Peridotite (Turnbull et al. Citation2017). Fe2O3 in all samples was multiplied by 0.8999 to give FeO.
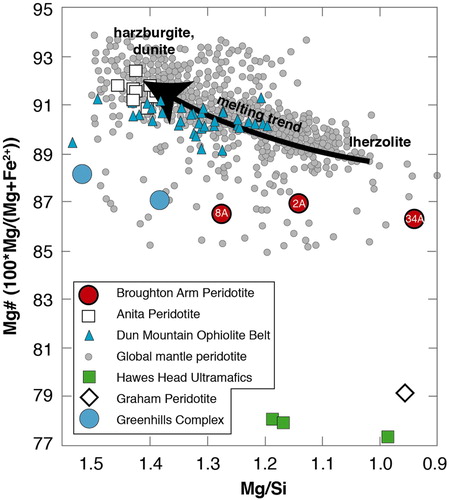
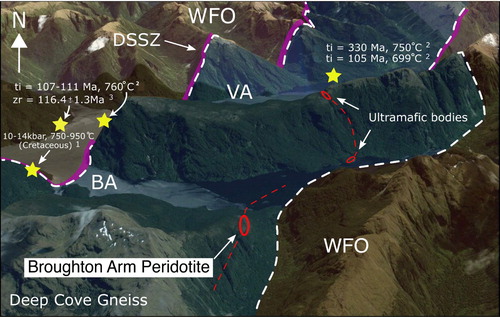
Figure 8. This oblique Google Earth-derived image shows the location of the Broughton Arm Peridotite, the Deep Cove Gneiss, the Western Fiordland Orthogneiss (WFO) and the Doubtful Sound Shear Zone (DSSZ). Note that the boundary between the Western Fiordland Orthogneiss and the Deep Cove Gneiss in the east of the Broughton Arm (BA) is mapped as a brittle fault by Turnbull et al. (Citation2010); this structure is younger than the ductile Doubtful Sound Shear Zone, and appears to have excised the shear zone. Ultramafic lithologies to the north have been located on the shoreline (Turnbull et al. Citation2010) and inferred by us from telephoto images and a helicopter flyby. Stars indicate proximal locations of published information discussed in more detail in the text; data are from 1, Allibone, Milan, et al. (Citation2009), 2, Schwartz et al. (Citation2016), 3, Schwartz et al. (Citation2017).