Figures & data
Figure 1. A, Location map of the Taupo Volcanic Zone in the North Island of New Zealand. B, Location of the Tongariro Graben and the Tongariro Volcanic Complex. Black and green dots represent 221 fault displacement measurements (117 Waihi Fault and 110 Poutu Fault) from geomorphic surfaces (see ) on individual traces. Individual displacements have been added across seventeen transects on each fault. Transects are marked with white lines. Field outcrops are marked with blue dots. UWS, Upper Waikato Stream. For more details about displacements, field outcrops, lithology and surface ages see Gómez-Vasconcelos et al., Citation2017.
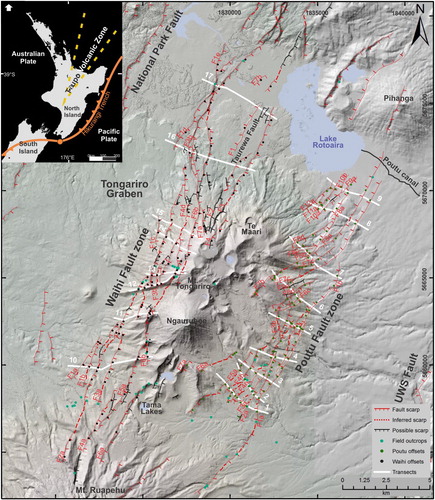
Table 1. Vertical displacements and slip-rates summary for the Tongariro Graben, from Waihi and Poutu fault zones transects and rift-bounding faults (from Gómez-Vasconcelos et al., Citation2017).
Figure 2. Along-strike fault slip distribution for the Waihi (A) and Poutu (B) fault zones. Bottom graph of each panel: The vertical axis displays individual fault strand vertical surface offsets of geomorphic surfaces for five different periods. Displacements for the same fault strand are connected with lines of different colours for different ages: blue for 0–20 ka, red for 20–40 ka, green for 40–60 ka, purple for 60–100 ka and black for >100 ka. Top graph of each panel: To obtain the total displacement for the 20–40 ka period at several locations along the faults, individual fault displacements were combined (summed) across transects perpendicular to the fault at those locations (see of transect locations). Within a transect, individual fault strands displace surface of different ages; therefore measured displacements of surfaces different to the 20–40 ka one, were interpolated to 20–40 ka. Summed values for the 20–40 ka period are used to evaluate the displacement variability along the faults and try to identify segmentation patterns (see Tables A1 and A2).
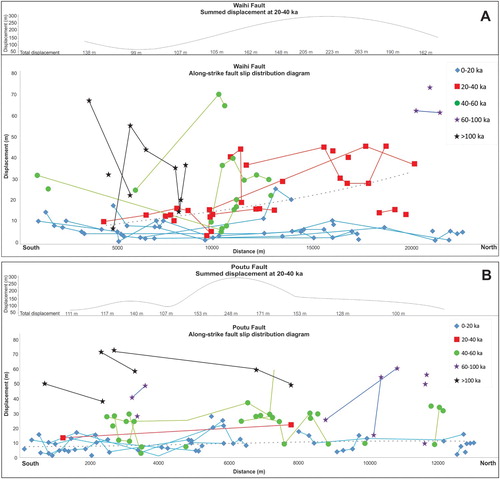
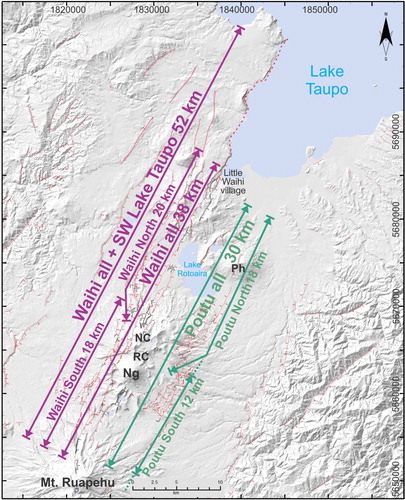
Figure 3. Potential segment surface-length rupture models for the Waihi and Poutu fault zones, marked with purple and green lines, respectively. Ng, Ngāuruhoe; RC, Red Crater; NC, North Crater; Ph, Pihanga.