Figures & data
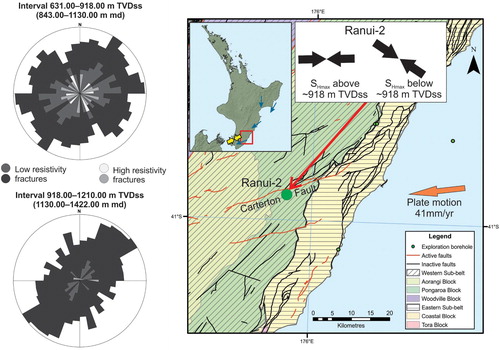
Figure 1. Map showing the location of the Ranui-2 borehole and other imaged wells in the southern onshore East Coast Basin, the active and inactive faults present in the area, and the sub-belts and structural blocks of Moore (Citation1988a). The inset map shows the present plate margin boundary (HMST – Hikurangi Margin subduction thrust) and the relative plate motion vectors from Nicol et al. (Citation2007). Boundaries are approximate.
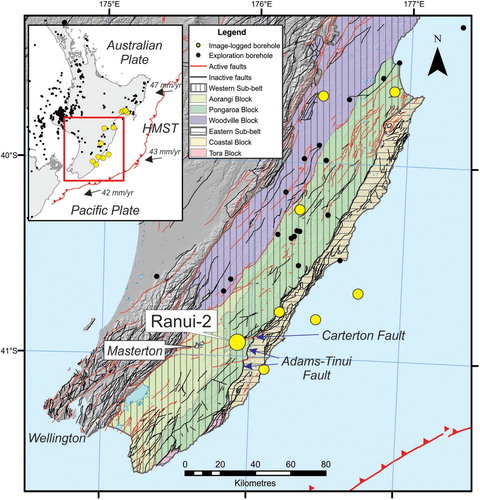
Figure 2. Schematic diagram showing the stratigraphy encountered in borehole Ranui-2, and the different data and depths at which they were acquired in the borehole. A schematic regional chronostratigraphic panel is to the right, illustrating the relationship between the stratigraphy in the borehole and the regional stratigraphy of the Western and Eastern Sub-belts. All depths are in metres measured depth (md). Borehole data from ECEV III Ltd (Citation2012). Chronostratigraphy adapted from Bland et al. (Citation2015). Stratigraphy not to scale.
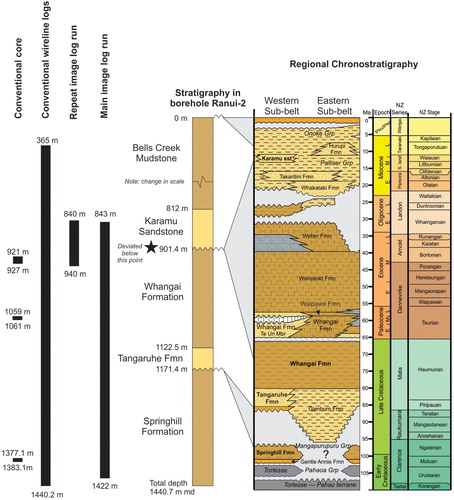
Figure 3. Borehole breakouts (white boxes) from A, Above and B, below the change in deviation at c. 940 m md in the FMI resistivity image log from borehole Ranui-2. A low confidence DITF (dashed white line) has been interpreted at c. 1009.50 m. The breakout orientation does not coincide with the high side of the borehole (indicated by the red ‘H’ on the images), eliminating the possibility that the breakouts are keyseats. Sinusoidal features in the images have been interpreted as fractures. The grey lines represent the space between the pads on the FMI imaging tool. C, Schematic cross-sections of borehole breakout and DITF formation (adapted from Hillis and Reynolds Citation2000). Borehole breakouts form when circumferential stress around the borehole exceeds the compressive rock strength and thus are oriented parallel to Shmin (σh). DITFs form when the circumferential stress exceeds the tensile strength of the borehole wall, thus are oriented parallel to SHmax (σH).
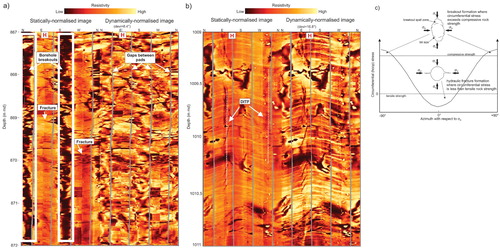
Table 1. Summary of fracture and in-situ stress feature counts by formation, for the Ranui-2 borehole.
Figure 4. Rose diagram showing the A, all the observed in-situ stress features in the entire imaged interval, prior to applying the circular statistical analysis of Heidbach (Citation2016a). Borehole breakouts are in black (n = 41), while DITFs are in grey (n = 2). B, C, and D, Scaled rose diagrams showing the mean SHmax azimuth directions determined from borehole breakouts identified from the imaged interval in borehole Ranui-2, using the circular statistical method. B, The entire imaged interval (843–1422 m md). C, The interval above the change in deviation (843–c. 940 m md). D, The lower deviated (≥10°) interval (c. 940–1422 m md) in the borehole. N = number of data points. The standard deviation is given in the brackets for each interval. The quality ranking follows the World Stress Map criteria of Heidbach (Citation2016a).
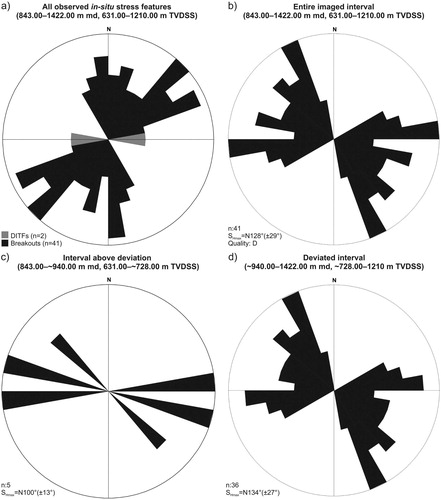
Table 2. Stress indicators from the analysed resistivity borehole image in Ranui-2, based on the changes in mean SHmax azimuth (shallow and deep) and deviation in the borehole (shlwdev and deepdev).
Figure 5. Compressional failure plot for Ranui-2, modelled using the Landmark RecallTM Sigma module. Input parameters are given in in the supplementary material. The plot shows that for a borehole with 25° deviation, borehole breakouts should have a strike azimuth of ∼50°–60°. The observed borehole breakout azimuths from the imaged interval in Ranui-2 strike at ∼55°. The compressional failure plot confirms that the borehole deviation is not affecting the borehole breakouts in Ranui-2. Plot is in Schmidt lower hemisphere.
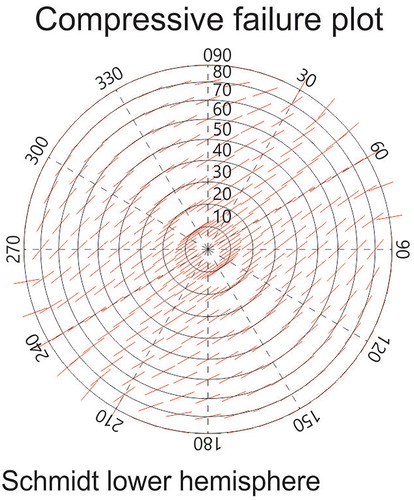
Figure 6. Depth partitioning of the mean SHmax azimuth direction in borehole Ranui-2. Borehole breakouts (BO) above c. 918 m TVDss (c. 1130 m md) indicate an azimuth of 089°–269° (blue), while below c. 918 m TVDss, the borehole breakouts show a 142°–322° azimuth direction (purple). The black arrow indicates the mean SHmax azimuth obtained from the DITFs identified in the interval above c. 918 m TVDss (n = 2). SHmax is calculated using the World Stress Map circular statistics calculations in Heidbach (Citation2016a). Triangles are derived from borehole breakouts, while squares depict the DITFs identified in the imaged interval of the borehole. Errors on SHmax azimuth are 1 standard deviation, calculated using circular statistics, borehole breakouts (BO) weighted by the BO number, quality ranking from the World Stress Map. nBO = number of BO; nDITF = number of drilling-induced tensile fractures. The black bar on the right indicates the depths of the imaged interval in borehole Ranui-2, in metres TVDss.
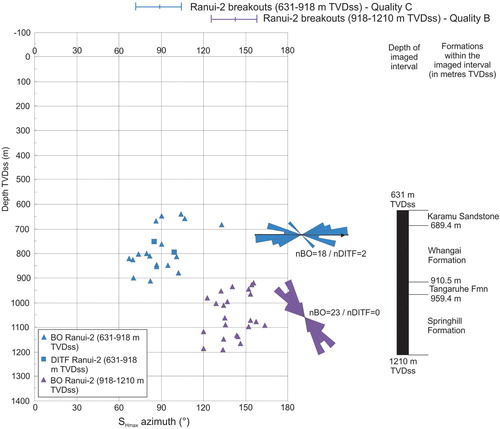
Figure 7. Rose histograms showing proportionally scaled fracture strike orientations, and dip magnitudes and directions for the fractures identified in the entire imaged interval in Ranui-2. A, Low resistivity fractures are in dark grey (full sinusoids, n = 78) and black (partial sinusoids, n = 500). B, High resistivity fractures are in white (full sinusoids, n = 4) and pale grey (partial sinusoids, n = 10).
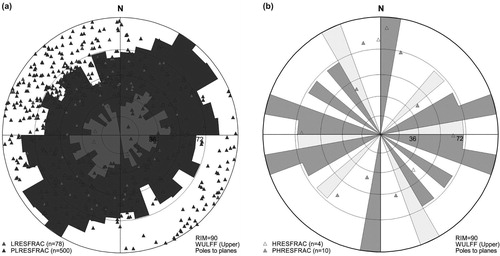
Figure 8. Rose histograms showing the proportionally scaled fracture strike orientations, and dip magnitudes and directions for the four fracture sets identified in Ranui-2, based on general fracture strike orientation. The formations identified in the imaged interval are shown in the middle, with fracture set (i) corresponding to the Karamu Sandstone, fracture sets (ii) and (iii) to the Whangai Formation, and fracture set (iv) comprising of the Tangaruhe and Springhill formations. The mean SHmax azimuth directions from the borehole breakouts (after circular statistics have been applied, but not corrected for well deviation) above and below c. 1130 m md, are shown on the right. The fractures in fracture set (i) strike in a similar W–E direction to the SHmax above 1130 m, while fracture sets (ii) and (iv) strike oblique to the NW–SE SHmax azimuth direction below 1130 m.
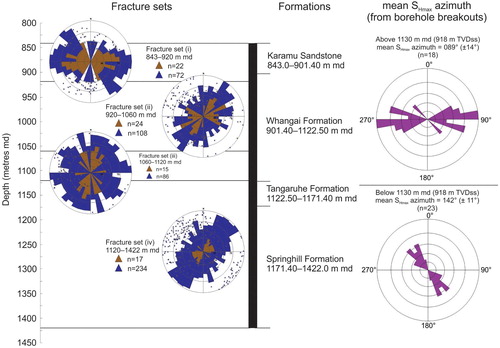
Figure 9. Proportionally scaled rose diagrams showing the present-day mean SHmax azimuth direction and fracture strike orientations for the fractures identified in the formations in the imaged interval in Ranui-2. The mean SHmax was determined from borehole breakouts identified from the imaged interval in borehole Ranui-2, using the circular statistical method of Heidbach (Citation2016a). Low resistivity fractures are in dark grey (full sinusoids) and black (partial sinusoids). High resistivity fractures are in white (full sinusoids) and pale grey (partial sinusoids).
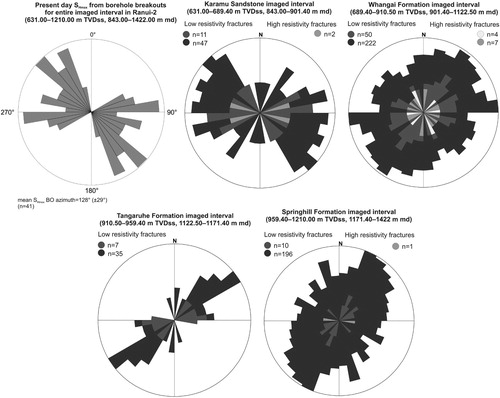
Figure 10. Rose histogram showing the proportionally scaled fracture strike orientations for the fractures above and below c. 918 m TVDss (c. 1130 m md) in borehole Ranui-2, based on the change in SHmax azimuths determined from the borehole breakouts. Note the greater spread in strike orientations for the fractures above c. 918 m TVDss. The in-situ stress directions for the same depth intervals are shown by the black arrows on the map. The active and inactive mapped faults in the Wairarapa area from Lee and Begg (Citation2002). The inset map shows the SHmax direction from focal mechanisms and plate motion data (yellow arrows) from Townend et al. (Citation2012), and the current geodetic direction (blue arrows) of the onshore East Coast Basin from Wallace et al. (Citation2004).