Figures & data
Figure 1. Current tectonic configuration of northern New Zealand annotated with loci of volcanism for three different time periods ± 0.5 Ma (circles: black = 0 Ma; grey = 8 Ma; white = 16 Ma) from Seebeck et al. (Citation2014b), geodetic vectors of extension (double arrows: Wallace et al. Citation2004) and relative plate motion (single arrows: DeMets et al. Citation1994) in mm/year. Dotted line represents a terrane suture in basement rocks as inferred from the Junction Magnetic Anomaly (JMA). Rotation of eastern North Island shown for period 3 Ma to present (Wallace et al., Citation2004). HR = Hauraki Rift; HT = Havre trough; NIFS = North Island Fault System; VMFZ = Vening Meinesz Fracture Zone. TVZ = Taupo Volcanic Zone shown in red, Coromandel Volcanic Zone shown in orange, Northland shown in blue.
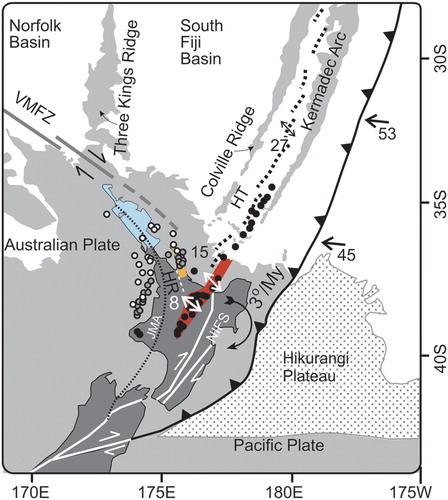
Figure 2. Structural architecture of the central North Island showing active faults in red (GNS Science Active Fault database (Lamarche et al. Citation2006), other faults in dashed black lines (Edbrooke Citation2005; Townsend et al. Citation2008; Giba et al. Citation2010), the Taranaki Fault (thick barbed line annotated with position of northern limit of activity through time: Stagpoole and Nicol Citation2008), the Junction Magnetic Anomaly (thick red dashed line). Periods of activity on extensional faults of western North Island are shown after Giba et al. (Citation2010). Position and timing of epithermal mineralisation and geothermal activity shown by green circles and red square polygons respectively. Red lines within green circles are approximate vein directions. Thick black dashed circles are calderas. Locations referred to in the text are numbered in white circles. WKF = Waikato Fault; OF = Ohura Fault, WP = Waipa Fault.
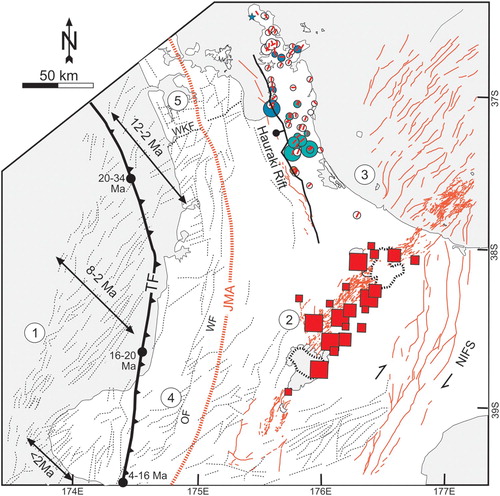
Figure 3. Geology of the Hauraki Goldfield and its surrounding areas (scale 1:250,000: Edbrooke Citation2001). Epithermal Au-Ag deposits are indicated by yellow circles, and their size refers to amount of gold production. KOST = Karangahake-Ohui structural trend, TWFZ = Tapu-Whitianga-Fault Zone, THHK = Tairua-Hikuai-Kaueranga Lineament.
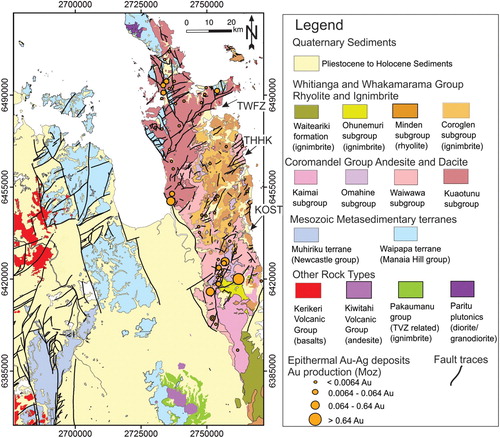
Table 1. Description of major rock types in the CVZ (after, Edbrooke Citation2001).
Table 2. Nomenclature, definition and use of selected image processing and imaging techniques applied to the aeromagnetic data.
Table 3. Major interpretation criteria to define magnetic lineaments, faults and deformation zones from the regional aeromagnetic data.
Figure 4. (a) Pseudocolour image of the Total Magnetic Intensity (TMI), (b) TMI, reduced to pole (RTP) of the Hauraki Goldfield, intensity layer illuminated from the northeast. DF = Drury fault, HF = Hauraki Fault, KB = Kerikeri basalt, KV = Kiwitahi volcanics, K = Karangahake. Letters a, b, c, and d refers to high-frequency magnetic anomalies. Polygons with a black outline in (a) indicate calderas (Skinner Citation1986; Malengreau et al. Citation2000; Smith et al. Citation2006). Polygons with a black outline in (b) refer to hydrothermal alteration areas (Christie et al. Citation2007; Morrell et al. Citation2011). White cross marks refer to areas with suspected remanant magnetisation, and white lines are rivers and paleochannels. Inset map in (a) refers to different parts of CVZ discussed in the text.
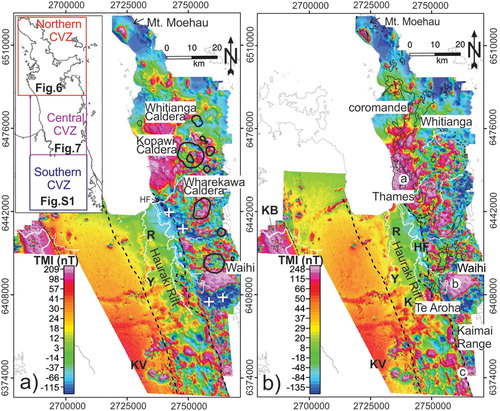
Figure 5. (a) Pseudocolour image of Analytical Signal (AS) showing hydrothermal alterations coinciding with regions of low AS value (black outline polygons: Christie et al. Citation2007). Polygons with white outlines indicate younger andesites and rhyolites that obscure hydrothermal alterations and exhibit high magnetic frequency. (b) Pseudocolour image of Horizontal gradient magnitude. (c) Pseudocolour image of Vertical Derivative (VD). (d) Pseudocolour image of Tilt Derivative (TD) with values greater than 0.0 to show the approximate width and distribution of features with positive susceptibility (Verduzco et al. Citation2004). See text for letters R and Y. KV = Kiwitahi Volcanics. Black/white circular feature refers to a high magnetic anomaly related to a deep intrusive body.
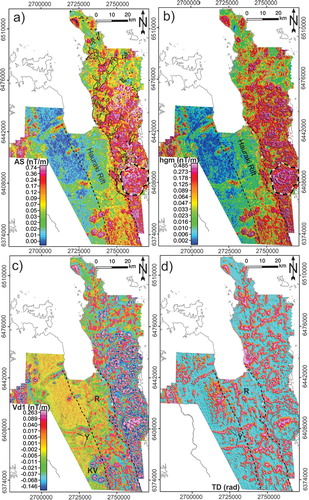
Figure 6. (a) Pseudocolour image of TMI-reduced to pole for the Northern CVZ illuminated from the northeast and annotated with interpreted structures. (b) Composite images of the tilt derivative superimposed onto the intensity layer of the vertical derivative of the reduced to pole TMI data for the same area as (a) and illuminated from the northeast and annotated with interpreted structures. (c) The corresponding geology map overlaid with interpreted structures. Abbreviations are: MF = Mangatu Fault; MhF = Matamata harakeke Fault; WF = Waitaia Fault; CF = Coromandel Fault. Labelled numbers (1–21) refer major interpreted faults and lineaments.
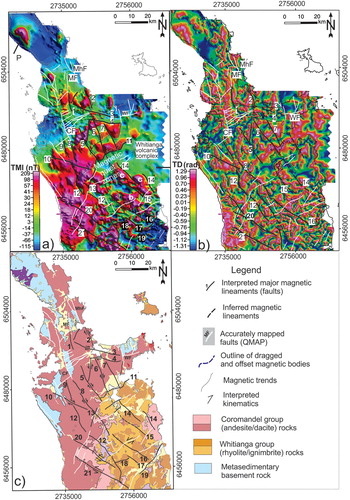
Figure 7. (a) Pseudocolour image of TMI-reduced to pole for the Central CVZ illuminated from the northeast overlaid with interpreted structures. (b) Composite images of the tilt derivative superimposed onto the intensity layer of vertical derivative and annotated with structural interpretations. (c) Corresponding geology map overlaid with interpreted structures. Overlaid lines are interpreted structures. Abbreviations: WF = Waihi Fault; OF = Owharoa Fault; WF = Waitekauri Fault; JF = Jubilee Fault; KF = Komata Fault; RF = Rotokohu Fault; MF = Mangakino Fault. Letters from a-to-g are regions of low magnetic anomaly interpreted as fault-angle basins. Labelled numbers (16–34) refer major interpreted faults and magnetic lineaments.
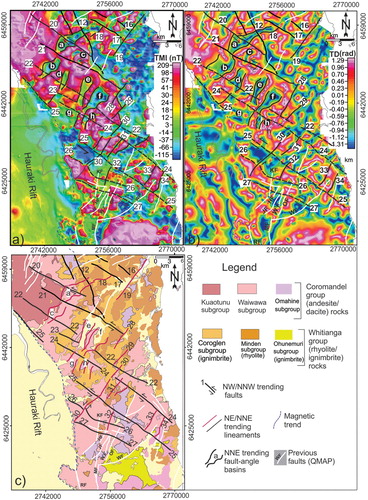
Figure 8. (a) Pseudocolour image of TMI-reduced to pole upward continued to 2 km. (b) Pseudocolour image of TMI-reduced-to-pole upward continued to 4 km. Upward continuation filter calculates the magnetic response of sources that are approximately one-half as deep as the upward continuation distance (Jacobsen Citation1987). This data shows the progressive change in shape and relative depth continuity of magnetic source bodies. (c) Composite image of analytic signal of aeromagnetic data upward continued to 4 km superimposed onto intensity layer of TMI-reduced-to-pole. Mapped surface alteration zones (Christie et al. Citation2007). Polygons of black outlines are deep magnetic quiet zones (interpreted in this study). (d) Zoomed pseudocolour image of TMI-reduced-to-pole for the area shown on Fig. b, and annotated with interpreted deep and shallow magnetic lineaments (labelled numbers 12, 21–27, 30, 32) and surface alteration zones. A1-A4 refers to high magnetic rock packages in the subsurface. Th = Thames, W = Waihi, KV = Kiwitahi Volcanics
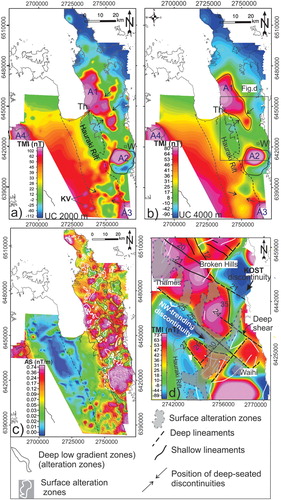
Figure 9. (a) Main concepts of edge detection in 2D section of data, apparent dip direction of edged and degree of worm sinuosity (Holden et al. Citation2000). (b) Worms produced using criteria (worm length > 1 km) and (worm sinuosity > 0.95). The degree of sinuosity ranges between 0 and 1; where 1 refers straight and non-sinuous. (c) Trend analysis for shallow and deep worms.
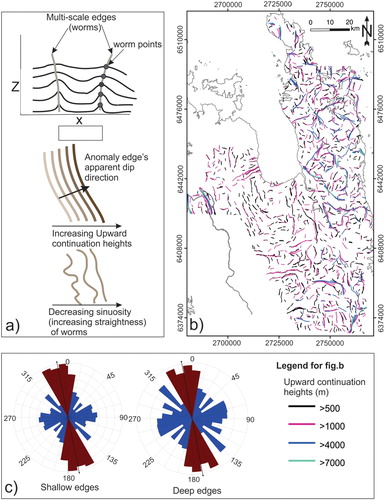
Figure 10. Interpretation of deep structural discontinuities. (a) Crustal-scale lineaments. (b) Deep magnetic worms (depth > 2 km). Wh = Whangamata, W = Waihi, K = Karangahake, GC = Golden Cross, BH = Broken Hills, CF = Coromandel Fault, KOST = Karangahake-Ohui structural trend, TWFZ = Tapu-Whitianga-Fault Zone, THHK = Tairua-Hikuai-Kaueranga Lineament. Labelled numbers (1–5) refer crustal lineaments with depth persistence greater than 3 km. Numbers labelled 6 and 7 refer magnetic lineaments with depth persistence up to 2 km.
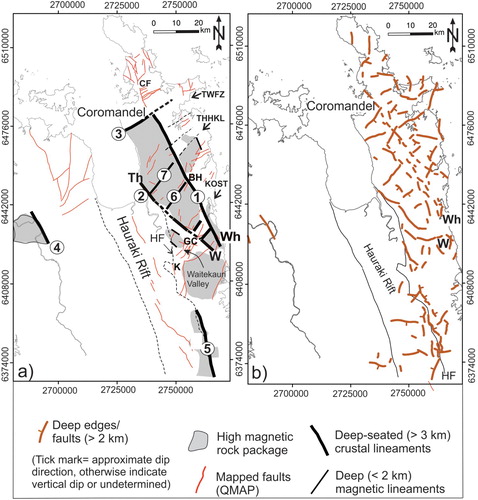
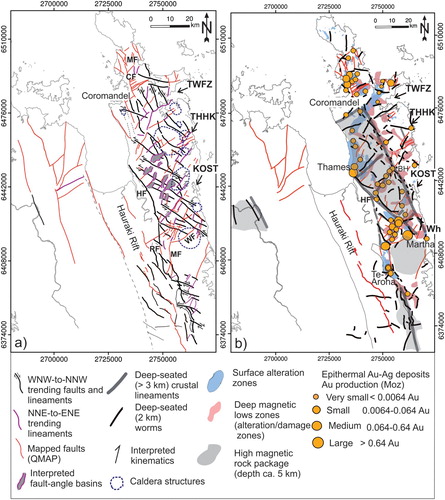
Figure 11. (a) Map showing shallow-seated structures interpreted from the short wavelength aeromagnetic anomalies. Overlaid shaded regions and circular features are interpreted discrete fault-angle basins and caldera structures respectively. (b) Map showing a summary of the magnetic fabrics in the Hauraki Goldfield. Surface hydrothermal alteration zones, deep alteration footprints (damage zones at depth) and epithermal deposits are overlaid on deep-seated crustal structures, illustrating the genetic and spatial links between crustal structures and epithermal systems. Surface hydrothermal alteration zones and location of mineral deposits with past gold production in the Hauraki Goldfield (after Christie et al. Citation2007). Abbreviations: WF = Waihi Fault; OF = Owharoa Fault; WF = Waitekauri Fault; JF = Jubilee Fault; KF = Komata Fault; RF = Rotokohu Fault; MF = Mangakino Fault; Wh = Whangamata, W = Waihi, K = Karangahake, GC = Golden Cross, BH = Broken Hills, CF = Coromandel Fault, KOST = Karangahake-Ohui structural trend, TWFZ = Tapu-Whitianga-Fault Zone, THHK = Tairua-Hikuai-Kaueranga Lineament.