Figures & data
Figure 1. Simplified maps of the Hauraki goldfield showing A, the geology and fault pattern (Skinner Citation1986, Brathwaite et al. Citation1989; Edbrooke Citation2001; Christie et al. Citation2007) and B, alteration zones and epithermal centres (veins). Alteration zones have been determined from field mapping and for some by a combination of mapping and aeromagnetic interpretations (Christie at al. 2001; Stagpoole et al. Citation2001). Inset shows the location of the Hauraki goldfield and the Taupo Volcanic Zone (TVZ), North Island of New Zealand.
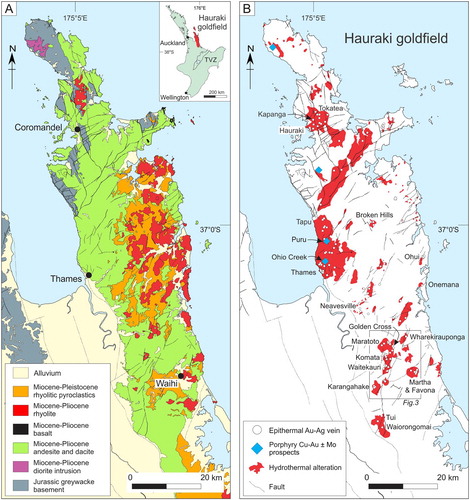
Figure 2. Geology maps of selected epithermal Au-Ag deposits: A, Karangahake (Brathwaite, Citation1989; Stevens and Boswell, Citation2006), B, Martha, Correnso and Favona, Waihi vein system (Torckler et al. Citation2016), C, Golden Cross (Keall et al. Citation1993; Simpson et al. Citation2001), D, Waitekauri (Simpson and Mauk, Citation2011), and E, Wharekirauponga (OceanaGold). Quartz veins are projected to surface except those at Karangahake, which are the surface trace.
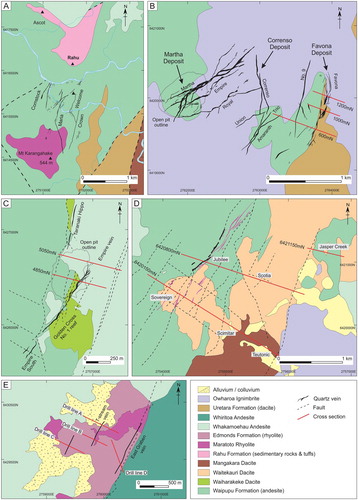
Figure 3. Aeromagnetic analytical signal pseudocolour image of the reduced-to-pole total magnetic intensity map for the southern Hauraki goldfield and showing quartz veins (OceanaGold). The boundaries of zones of very low magnetic gradient are marked by the solid and dashed white lines (modified Morrell et al. Citation2011). These generally outline the extent of strong hydrothermal alteration in which magnetite has been destroyed. The zone of low magnetic gradient response east of Karangahake is related to non-magnetic sedimentary rocks. The location of this area in the Hauraki goldfield is outlined in B.
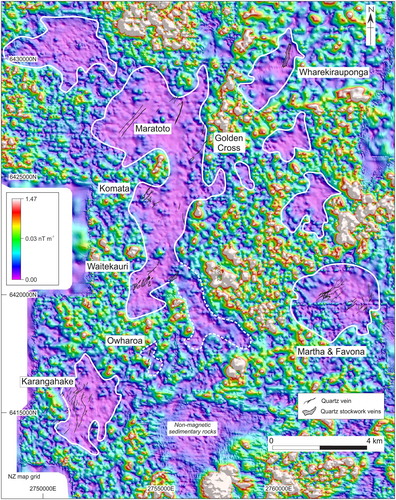
Figure 4. Digital microscopic images of hydrothermal alteration minerals replacing volcanic rocks. A, Feldspar phenocrysts completely altered to adularia and albite (WV006 254.2 m, Jubilee), B, feldspar phenocryst altered to adularia with fractures filled by later trace illite (ML7 36.0 m, Sovereign), C, feldspar phenocrysts altered to adularia and later illite (sample AU#57552, Karangahake), D, feldspar phenocryst altered to adularia, illite and overprinted by calcite (WV007 166.5 m, Jubilee), E, feldspar phenocryst completely altered to illite (ML11 146.6 m, Sovereign), F, feldspar phenocryst completely altered to calcite (WV011 194.8 m, Scimitar) G, pyroxene phenocrysts altered to chlorite. Adjacent feldspar phenocrysts are altered to illite (WV008 204.95 m, Jubilee), H, plagioclase phenocryst partly altered by calcite. The groundmass is partially altered to smectite (WV009 466.2 m, Jasper Creek).
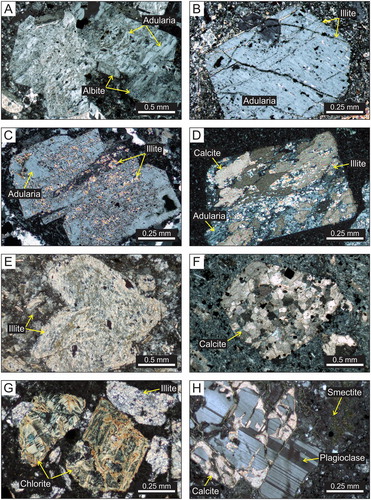
Figure 5. Images of hydrothermally altered rock (left) and corresponding automated mineralogy map (right) for samples from the Karangahake deposit. Note that left and right images are from different parts of the same slabbed rock surface. The different colours for the automated map represent different minerals with selected minerals indicated in the legend and their corresponding amount. A, Adularia, quartz and chlorite altered andesite. Feldspar phenocrysts are altered to adularia, and pyroxene phenocrysts altered to chlorite (AU#57555). B, Quartz, adularia, illite and chlorite altered andesite with phenocrystic feldspar altered to adularia and illite (AU#57491). C, Andesite pervasively altered to quartz, illite and minor pyrite. Faint outlines of feldspar phenocrysts are poorly preserved (AU#57548). D, Auto-brecciated andesite altered to quartz, albite, adularia, chlorite and calcite. Albite occurs throughout the sample, whereas adularia is concentrated in the auto-breccia matrix and rims the clasts. Adularia is interpreted to have formed later than the albite (AU#57510).
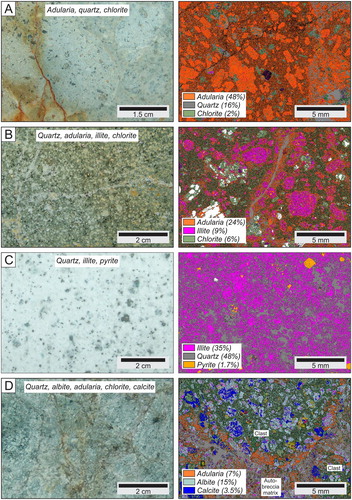
Figure 6. Images of hydrothermal altered rock (left) and corresponding automated mineralogy map (right) for samples from the Karangahake deposit. Note that left and right images are from different parts of the same slabbed rock surface. The different colours for the automated map represent different minerals with selected minerals indicated in the legend and their corresponding amount. A, Quartz, illite, chlorite, calcite and albite altered andesite with irregular calcite vein (AU#57568). B, Quartz, albite, calcite, chlorite and illite altered andesite. The sample contains a significant amount of albite that mainly occurs as an alteration mineral in the groundmass (AU#57545). C, Moderately quartz, albite, calcite and chlorite altered andesite. Plagioclase is partially altered to albite, whereas pyroxene is completely altered to calcite with minor chlorite. The groundmass is quartz (24%) altered (AU#57574). D, Weakly quartz, chlorite, calcite altered andesite with hematite vein. Plagioclase and diopside are essentially unaltered whereas enstatite is altered to chlorite and calcite. The groundmass is also partly altered to chlorite and quartz (AU#57573).
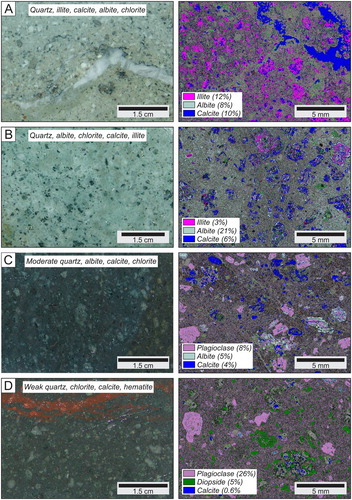
Figure 7. Surface maps showing the distribution of hydrothermal alteration minerals at the Karangahake deposit identified from XRD. A, Major veins plus outlines for the aeromagnetic demagnetised zone and radiometric K anomaly (Harris et al. Citation2005), B, adularia, C, albite, D, illite, mixed-layered illite-smectite, smectite, E, chlorite, and F, calcite. (Stuart et al. Citation2005; Simpson et al. Citation2019). Sample locations are marked by x’s. The amount of interlayered illite in mixed-layered illite-smectite is indicated in the boxes; 0.9 corresponds to an illite-smectite with 90 percent illite.
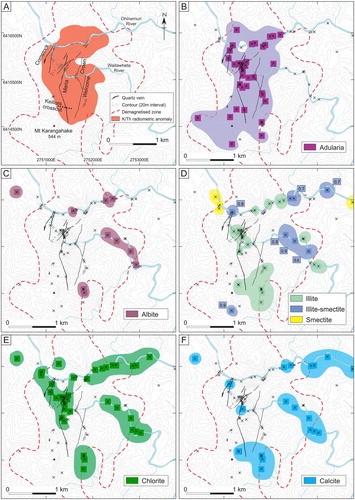
Figure 8. Mineral percentages of selected hydrothermal alteration minerals determined from quantitative XRD for samples along the Keillors crosscut, Karangahake deposit. The amount of adularia is greater in altered rocks near to the Maria, Welcome/Crown and Mystery veins. Albite and chlorite are present in samples between the veins but is absent in the samples directly adjacent the Maria and Welcome/Crown veins (Simpson et al. Citation2019). The amount of quartz shows minor variation, though notably in a few samples, the amount of adularia exceeds that of quartz. The location of the Keillors crosscut is shown in figure 7A.
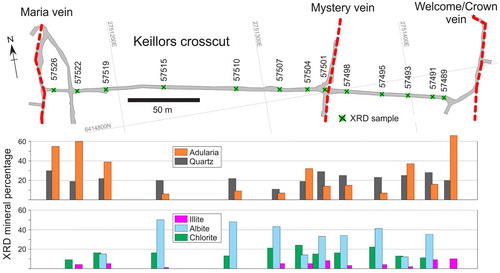
Figure 9. Maps showing the distribution of hydrothermal alteration minerals in the Martha open pit identified from XRD, A, adularia, B, albite, C, illite, illite-smectite, smectite, D, chlorite, and E, calcite (Castendyk et al. Citation2005; Simpson and Mauk Citation2007). The amount of interlayered illite in mixed-layered illite-smectite is indicated in the boxes; 0.9 corresponds to an illite-smectite with 90 percent illite. Smectite and illite-smectite with 70–80% illite occur in lenses of weakly altered rock (‘hard bars’). Veins are at 1,020 m RL (1,000 m RL = seal level), and contours are at 20-m intervals. Circles show sample locations. The location of the Martha open pit is shown in figure 2B.
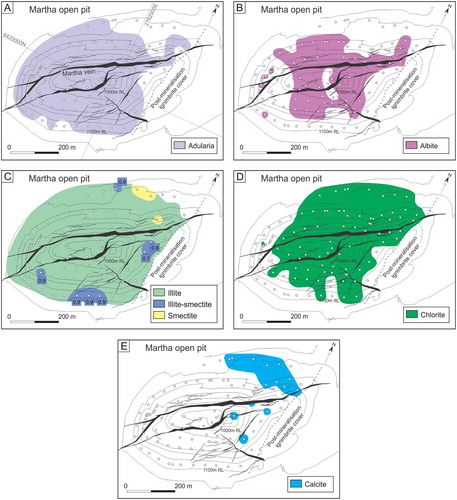
Figure 10. Cross sections along the 1000mN and 600mN drill lines showing the distribution of alteration minerals at the Favona deposit identified from XRD. A, And B, adularia plus albite, C, and D, illite, illite-smectite and smectite, E, and F, chlorite plus calcite (Simpson and Mauk Citation2007). Calcite is shown as spot samples due to minor and sporadic occurrence. Circles show sample locations. Cross section locations are shown in figure 2B. RL = relative level with 1,000m RL = sea level.
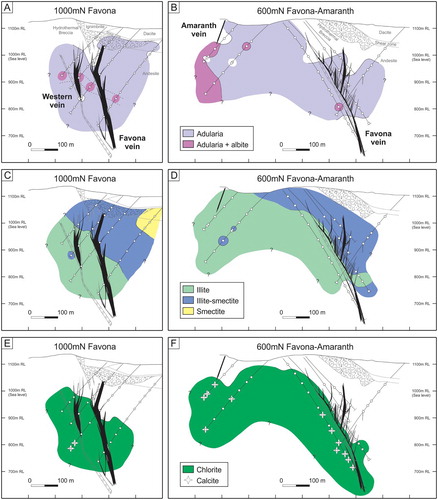
Figure 11. Cross sections along the 5050mN and 4850mN drill lines showing the distribution of alteration minerals at the Golden Cross deposit. A, And B, adularia, C, and D, illite and illite-smectite, E, and F, calcite (modified Simpson et al. Citation2001). The occurrence of chlorite is not shown as it is ubiquitous. Circles show sample locations. Cross section locations are shown in figure 2C. RSL = relative current sea level.
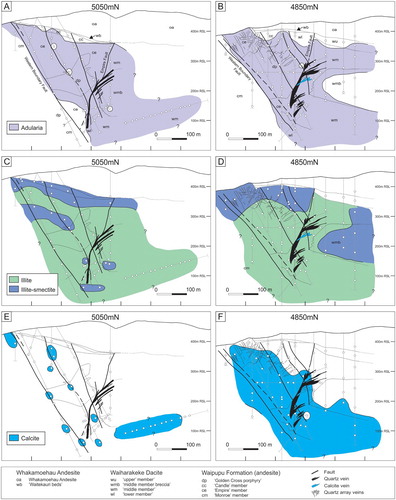
Figure 12. Cross sections through the Waitekauri deposits and prospects showing the occurrence of selected alteration minerals identified from XRD and petrography. A, Adularia, albite and igneous plagioclase, B, illite, illite-smectite and smectite, C, chlorite plus epidote, and D, calcite (modified Simpson and Mauk Citation2011). Circles show sample locations. Several drill holes protrude above the cross section topographic surface because they have been projected onto the section. Cross section locations are shown in figure 2D. RSL = relative current sea level.
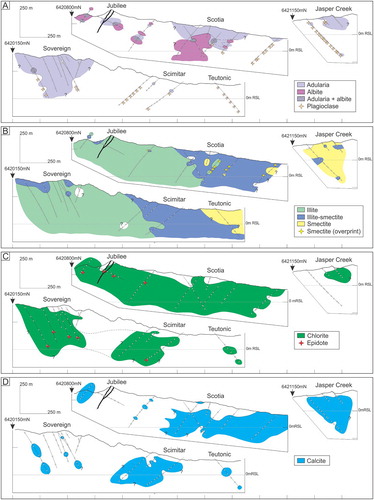
Figure 13. Representative reflectance spectra of alteration minerals. A, Smectite, B, mixed-layered illite-smectite with 70 percent illite, and C, illite, Waitekauri deposits and prospects. Smectite, illite-smectite and illite all have absorption features at ∼1410 nm, ∼1910 nm and ∼2205 nm, but have different absorption intensities and can be differentiated based on the H2O/Al-OH depth ratio (). D, To H, NH4-minerals from the Wharekirauponga prospect. E, Buddingtonite and H, NH4-illite. Since a spectral profile is the sum of all spectrally responsive minerals a sample with both buddingtonite and illite can generate a spectral profile that resembles NH4-illite. Spectral profiles for samples E, F and possibly G appear to be mixtures of buddingtonite and illite with varying amounts of each mineral. The greater the amount of illite the more subdued the signal from buddingtonite.
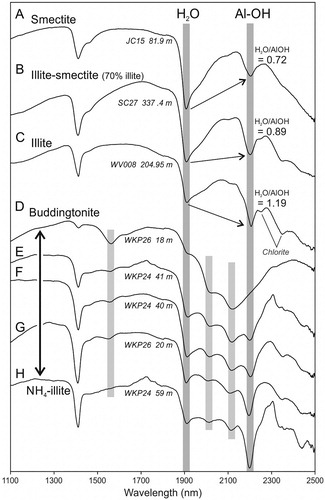
Figure 14. Reflectance spectrometry calculated H2O/Al-OH depth ratio plotted against Al-OH wavelength value for samples from the Waitekauri deposits and prospects and deposits with clay type distinction based on clay-separate XRD. A, Data for smectite, mixed-layered illite-smectite and illite with proposed dashed spectral threshold H2O/Al-OH depth values; <0.8 and >1.0 generally correspond to smectite and illite. B, Mixed-layered illite-smectite (IS) with illite percentages from clay separate XRD differentiated (Simpson et al. Citation2006).
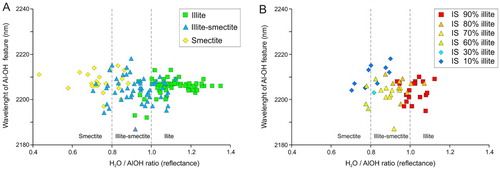
Figure 15. Cross sections through the Waitekauri deposits and prospects showing the distribution of smectite, mixed-layered illite-smectite and illite, identified from reflectance spectroscopy (Simpson et al. Citation2006). The overall distribution of these clays matches that determined from clay separate XRD (B). Circles show sample locations. Several drill holes protrude above the cross section topographic surface because they have been projected onto the section. Cross section locations are shown in figure 2D. RSL = relative current sea level.
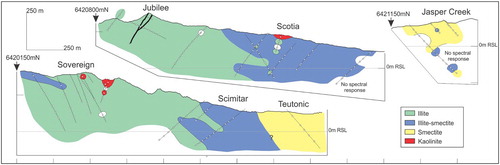
Figure 16. Cross sections along the 1200mN and 1000mN drill lines showing the distribution of NH4-minerals at the Favona deposit (Simpson Citation2015). The locations of the cross sections are shown in figure 2B. Reflectance spectra at Favona were collected on average every 5 m but only those identified with ammonium are shown (circles). RL = relative level with 1,000m RL = sea level.
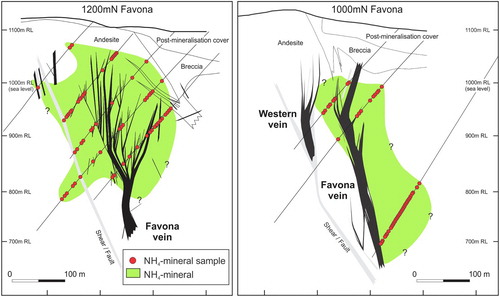
Figure 17. Cross sections along drill lines A to D showing the distribution of NH4-minerals at the Wharekirauponga prospect (Simpson Citation2018). NH4-minerals broadly envelop or occur adjacent to many of the sheeted quartz vein zones and quartz veins, but there are some veins in which the adjacent rocks lack NH4-minerals. On drill line section A, NH4-minerals are continuous along drill hole WKP-24 to a drilled depth of 220 m, but in an adjacent drill hole, WKP-26 only occur to a drilled depth of 120 m. Circles show sample locations. The locations of the cross sections are shown in figure 2E. RSL = relative current sea level.
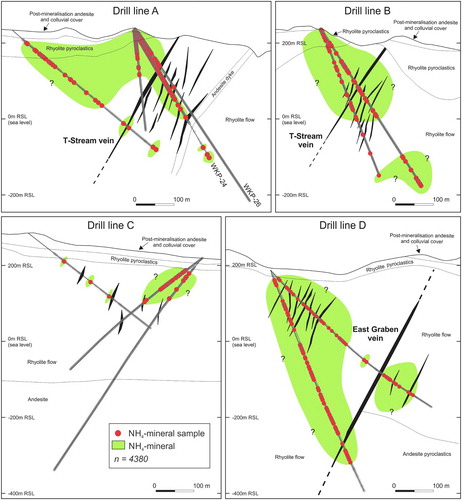
Figure 18. The lateral extent of selected alteration minerals in relation to the Empire, Favona and Martha veins. Data for the Empire vein (Golden Cross) and the Favona vein (Waihi vein system) is from drill line cross sections (shown in Figs 2B and 2C). Data for the Martha vein (Waihi vein system) is based on open pit exposures and a 1 km horizontal drill hole drilled to the NW (UW462 data from Bodger Citation2015).
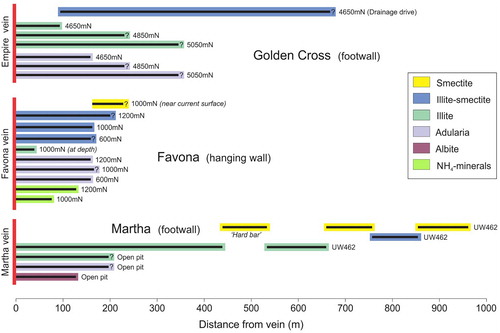
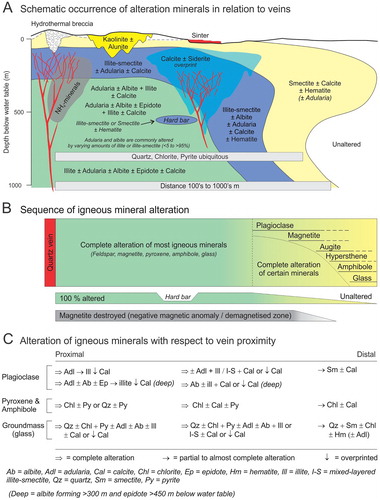
Figure 19. Summary aspects of hydrothermal alteration for epithermal deposits of the Hauraki goldfield. A, Schematic distribution of hydrothermal minerals in relation to veins. B, Sequence of igneous mineral alteration. C, Alteration of igneous minerals.