
Figures & data
Figure 1. Geological map of the southern Taranaki Basin, showing key basement lithologies and structures. Coordinates are in degrees and decimal degrees, WGS84. Onshore geology modified from Rattenbury et al. (Citation1998), offshore geology modified from Tulloch and Mortimer (Citation2017), structure from King and Thrasher (Citation1996).
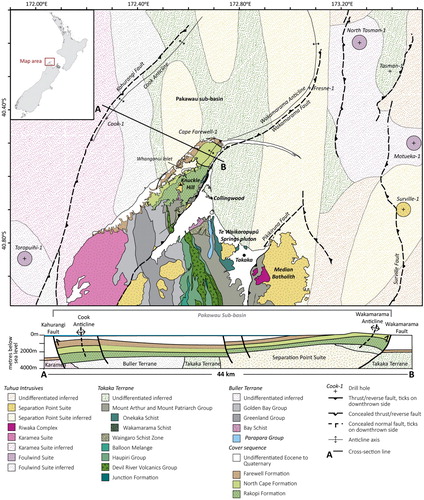
Figure 2. (A) chronostratigraphic diagram showing Late Cretaceous to Paleocene stratigraphy of the Pakawau Sub-basin, after King and Thrasher (Citation1996) and Higgs et al. (Citation2010). (B) summary of northwest Nelson basement ages, showing units discussed in text. Tuhua Intrusives shown as magmatic activity throughout Zealandia after Mortimer et al. (Citation2014), with units discussed in text labelled.
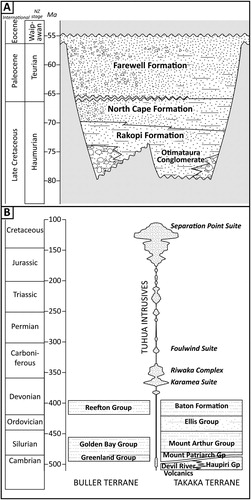
Table 1. Raw clast count data and conglomerate outcrop locations.
Table 2. sample: Sample details and location. Full geochemical and petrographic datasets are available online through the Petlab database (Strong et al. Citation2016), sample ID is provided.
Figure 3. Clast count results organised by outcrop location, with locations discussed in text labelled. Geological map modified from Rattenbury et al. (Citation1998).
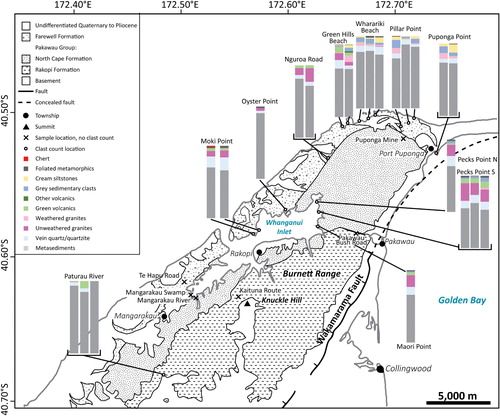
Figure 4. Clast count results organised into approximate stratigraphic position, with oldest conglomerates to the left.
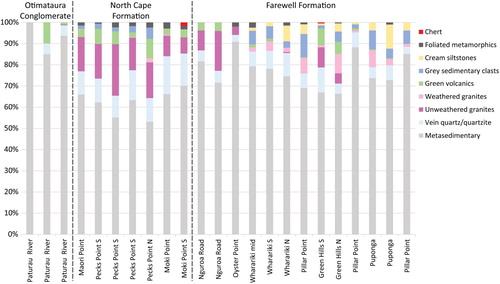
Figure 5. Quartz-feldspar-lithics (QFL) diagram after Folk et al. (Citation1970), showing composition of the metasedimentary clasts in the North Cape and Farewell formations compared to basement sources. Clasts are divided into their textural groups. Data source: Golden Bay Group Strong et al. (Citation2016), see methods for details; Greenland Group Laird (Citation1972); Baton Group Strong et al. (Citation2016); Ellis Group original work from thin sections UC16743-UC16746, Strong et al. (Citation2016); Mount Arthur Group Strong et al. (Citation2016); Haupiri Group Pound et al. (Citation1993).
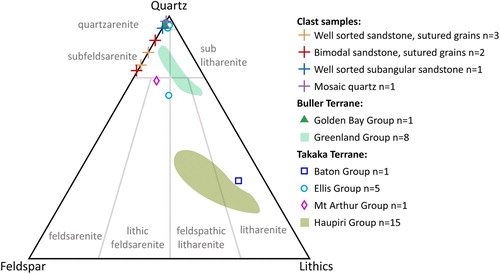
Figure 6. Selected photomicrographs showing metasedimentary clast mineralogy and textures in plane- (PPL) and cross-polarised light (CPL). Scale bar is 200 μm. (A) Wh285 (CPL), metasedimentary clast with sutured quartz (Q: quartz). (B) Pu226 (CPL), metasedimentary clast with sutured quartz (Q: quartz) in a silt matrix. (C/D) Wh277.1 (PPL/CPL), metasedimentary clast, subangular very fine sandstone with dirty grain boundaries. (E) Pu227.1 (CPL), cream coloured sedimentary clast with fine silt quartz and clay matrix. Vein in centre filled with quartz.
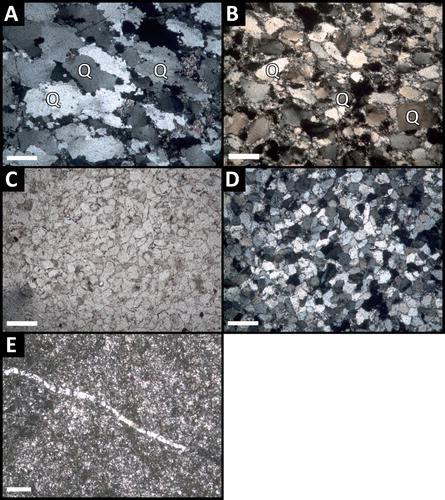
Figure 7. (A) Plot of K2O/Na2O against SiO2, after Roser et al. (Citation1996), comparing the major element geochemistry of the Takaka and Buller Terrane sedimentary and metasedimentary units to metasedimentary clasts. Clasts are grouped by petrographic texture. (B) Major element provenance discrimination plot (Roser and Korsch Citation1988) of metasedimentary clast samples compared to basement sources. Mount Arthur and Mount Patriarch Group have anomalously high F1 and F2 due to calcareous biogenic components increasing CaO. F1 = −1.773 TiO2 + 0.607 Al2O3 + 0.76 Fe2O3T −1.5 MgO + 0.616 CaO + 0.509 Na2O −1.224 K2O − 9.09; F2 = 0.445 TiO2 + 0.07 Al2O3−0.25 Fe2O3T −1.142 MgO + 0.438 CaO + 1.475 Na2O + 1.426 K2O − 6.861.
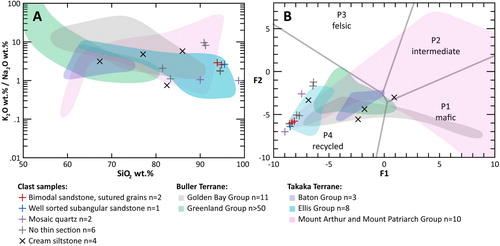
Figure 8. Spider diagrams for metasedimentary clasts compared to key basement sources. Normalised to average post-Archean shale (APAS) of Taylor and McLennan (Citation1985).
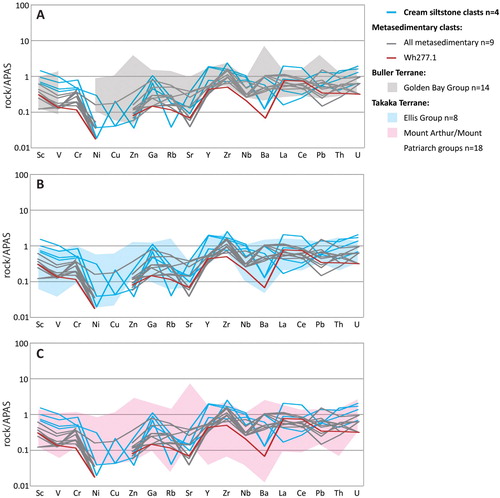
Figure 9. Selected photomicrographs showing granitoid clast mineralogy and textures in cross-polarised light. Scale bar is 200 μm. (A) PP184.1, equigranular (syeno)-granite clast with perthitic alkali feldspar. (B) Wh273, weathered equigranular (monzo)-granite, with feldspar crystals partially replaced by kaolinite and indeterminate clays. Titanite crystal is replaced by opaques. Quartz crystals have undulose extinction and are unaltered. (C) MP038, foliated porphyritic (syeno)-granite clast with perthitic alkali feldspar. Medium-grained matrix with foliation (top-left to bottom-right) shown by biotite. Q: quartz; Kf: alkali feldspar; Pl: plagioclase; B: biotite; Ti: titanite replaced by opaques.
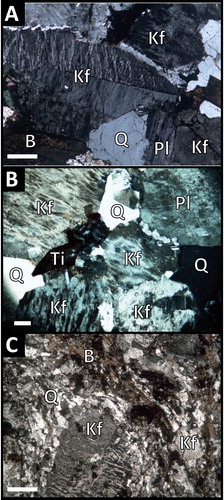
Figure 10. Quartz-alkali feldspar-plagioclase IUGS classification of granitoid clast petrography (Le Maitre Citation2004). Clasts are grouped based on the petrographic texture (indicated by colour, blue denotes equigranular, n = 16, red foliated, n = 1, and black foliated porphyritic, n = 10) and on the trace element geochemistry (symbol shape). Knuckle Hill data from this study, other basement data from Strong et al. (Citation2016).
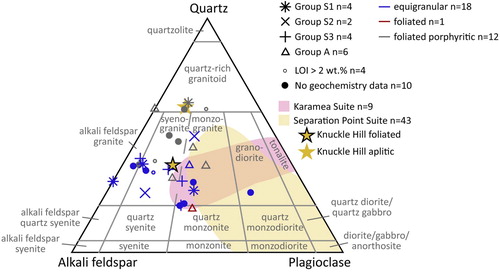
Figure 11. Chondrite normalised spider diagram of granitoid clasts with (A) trace element geochemistry similar to the Separation Point Suite, (B) trace element geochemistry dissimilar to either the Separation Point Suite or the Karamea Suite, and (C) likely A-type geochemistry compared to the Foulwind Suite including granitoids intersected by offshore wells. Samples with LOI >2 wt.% are excluded as these are likely to be affected by weathering. Chondrite data from Sun and McDonough (Citation1989).
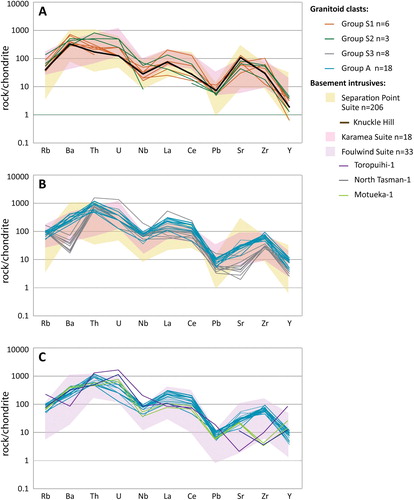
Figure 12. Ternary diagram of alkali major element geochemistry for the granitoid clast samples compared to potential basement sources.
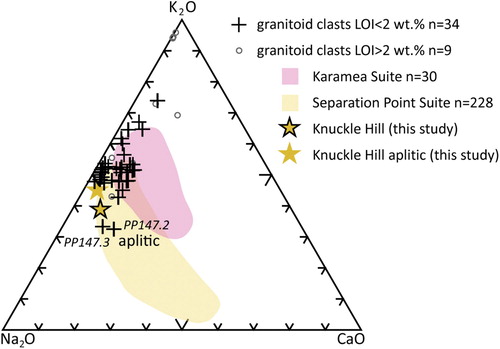
Figure 13. Selected photomicrographs showing volcanic clast mineralogy and textures in cross-polarised light. Scale bar is 200 μm. (A) OP074, porphyritic volcanic clast with plagioclase and alkali feldspar phenocrysts in a fine-grained crystalline groundmass. (B) MP040.4, porphyritic volcanic clast with pseudomorphed amphibole phenocrysts replaced by chlorite, diagnosed by their characteristic six-sided habit. Darker, equant phenocrysts are interpreted as pseudomorphed pyroxene. (C) MP040.3, silicified tuff clast. Embayed quartz crystal (bottom middle). Matrix has silicified, cuspate glass shards. Q: quartz; Kf: alkali feldspar; Pl: plagioclase; A: (pseudomorphed) amphibole; Px: (pseudomorphed) pyroxene.
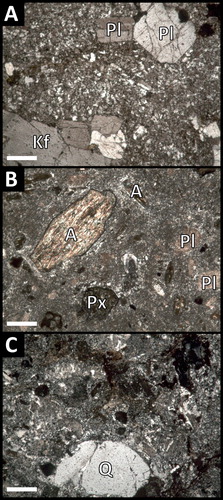
Figure 14. N-MORB normalised spider diagram for all available trace elements in the volcanic clasts compared to Takaka Terrane volcanics and to average OIB. Element order after Pearce et al. (Citation1984), N-MORB and OIB data from Sun and McDonough (Citation1989).
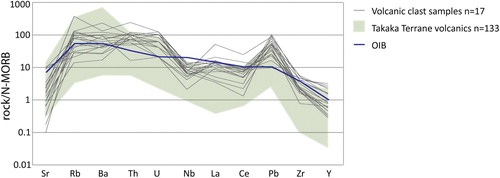
Figure 15. Photomicrograph of schist clast (OP073) with foliated quartz, biotite, clays. In cross-polarised light, scale bar is 200 μm.
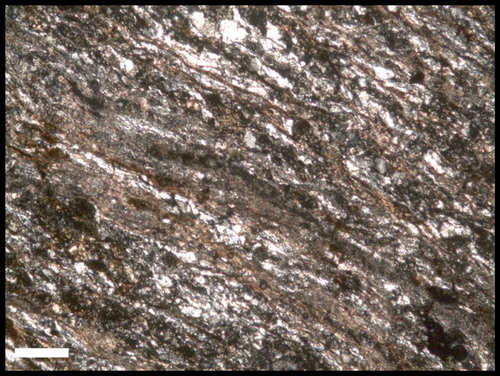
Figure 16. Quartz-feldspar-lithic (QFL) diagram after Folk et al. (Citation1970) showing overall composition and lithic composition of samples from the (A) Rakopi, (B) North Cape and (C) Farewell formations. Data from Browne et al. (Citation2008) and outcrop sample data from Higgs et al. (Citation2010) is shown as grey symbols. Metasedimentary lithics are grouped with sedimentary lithics on lithic ternary plot. Points are shaded according to the approximate stratigraphic position of the samples.
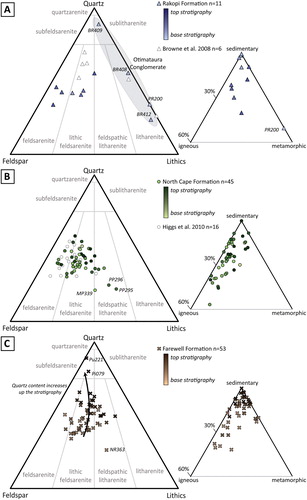
Figure 17. (A) Sandstone tectonic setting discrimination diagram after Dickinson et al. (Citation1983). Note that this diagram is intended for medium sandstones, coarse and very coarse sandstones are typically enriched in lithics and fine and very fine sandstones are depleted. (B) Quartz provenance discrimination plot after Basu et al. (Citation1975). Data points are shaded according to approximate stratigraphic position.
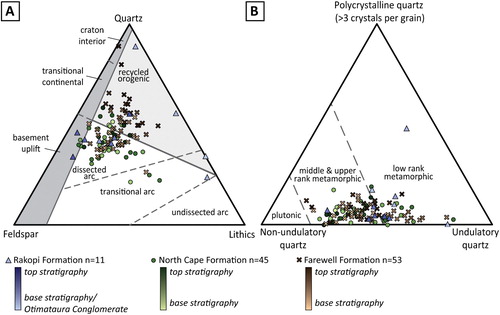
Figure 18. Photomicrographs of sandstones showing key components. All photomicrographs in cross-polarised light. (A) PR200, schist lithics in Otimataura Conglomerate sandstone from the Paturau River. (B) BR408, Otimataura Conglomerate sandstone from the Pakawau Bush Road, with sedimentary and metasedimentary lithics in an organic rich silt matrix. (C) PP144, North Cape Formation sandstone with subrounded grains in porous matrix. Volcanic lithic (centre) has plagioclase laths. (D) Wh269, Farewell Formation sandstone with moderately sorted subangular texture, in centre of view is siltstone lithic with high birefringent clay minerals. (E) PP296, very fine sandstone lithic (outline) with quartz, feldspar, and lithic grains. (F) PP296, equigranular plutonic lithic (outlined) with microcline, plagioclase, quartz, and biotite. Qz: quartz; Poly: polycrystalline quartz; K: alkali feldspar; Plag: plagioclase feldspar; Bio: biotite; Musc: muscovite; Chl: chlorite; Opq: opaque; Org: organic matter; Sed: (meta)sedimentary lithic; Volc: volcanic lithic; Sch: schist lithic; Plut: plutonic lithic.
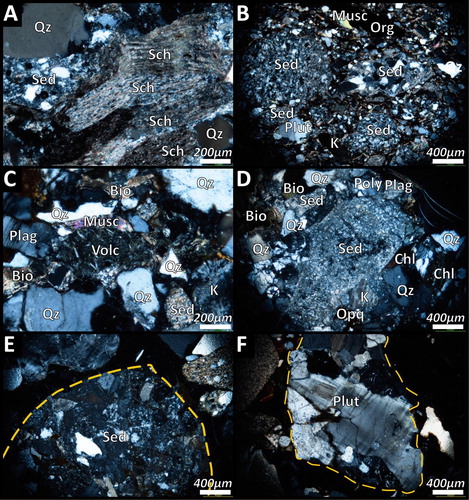
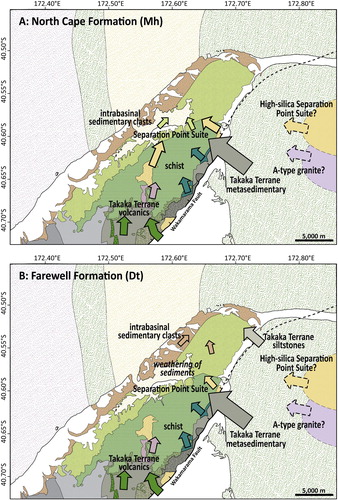
Figure 19. Maps showing transport pathways of conglomerate clast types for (A) the North Cape Formation and (B) the Farewell Formation, flow directions interpreted from conglomerate clast provenance and outcrop of source material. See for map legend.
Supplementary data
Download MS Excel (72.4 KB)Data availability statement
The data that support the findings of this study are openly available in the Petlab database at http://pet.gns.cri.nz/, collection numbers UC21170–UC21400