Figures & data
Figure 1. Locality map of the western Waikato Region.
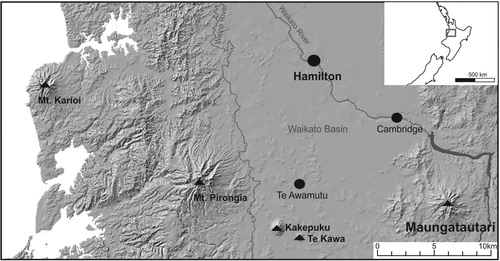
Figure 2. Geologic map for Maungatautari and its surrounds with lithologies of key in situ outcrops identified.
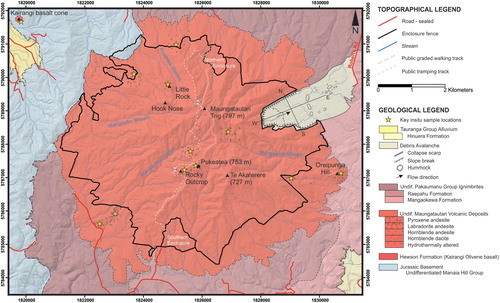
Figure 3. Geomorphology of the Maungatautari rock avalanche. A, View eastward of the area affected by a rock avalanche from the top of the breakaway scarp. The steep-sided walls are covered in native bush and form a characteristic horse-shoe pattern surrounding predominantly flat, poor-draining land. Arrows point to large hummocks which lie to the east from the edge of the tree line. B, North-south and west-east GIS cross-sectional profiles outlined in . C, Large proximal hummock consisting of medium-sized, poorly sorted and massive angular to sub-angular blocks and matrix mantled by post-collapse tephra deposits.
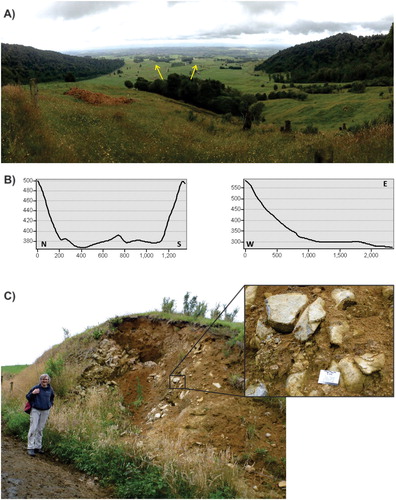
Figure 4. Representative mineralogy and micro-textures of Maungatautari A, labradorite andesite, B, pyroxene andesite, C, hornblende dacite and D, Kairangi olivine basalt. Abbreviations: Pl = plagioclase; Cpx = clinopyroxene; Opx = orthopyroxene; Hbl = hornblende, Ol = olivine.
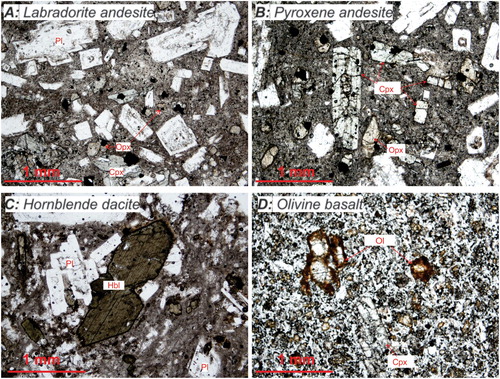
Table 1. Modal analyses (count %) of selected Maungatautari lavas based on a minimum of 350 counts per slide.
Figure 5. Quarry #34. A, Stratigraphic log showing units QT1 to 9, and the facies type assigned to each unit. B, Outcrop photograph.
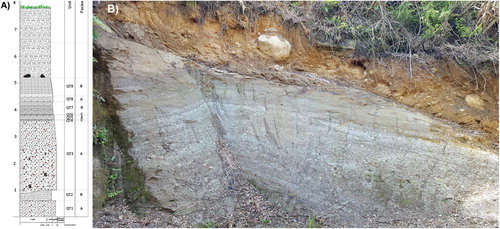
Figure 6. Summit quarry. A, Stratigraphic log showing units SQ1 to 3, and the facies type assigned to each unit. B, Outcrop photograph.
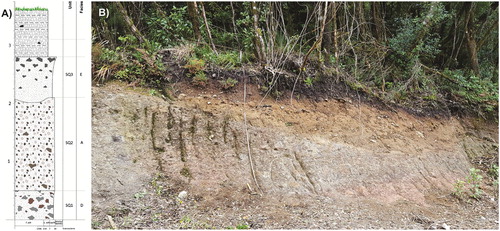
Figure 7. A, Facies A, B and C in outcrop at quarry #34 where the massive lapilli tuff of facies A contrasts with the laminated-bedded crystal and lithic-rich coarse tuff and very-fine lapilli of facies B. The thin tuff beds of facies C form two thin and laterally continuous bands across the outcrop. B, Facies A within unit SQ2 at the summit quarry. C, Facies D in outcrop at the summit quarry displaying red-coloured, matrix-supported, poorly sorted, non-welded massive lapilli-block tuff. D, Facies E of unit SQ3 within the summit quarry showing reverse grading of blocks and a fines-rich basal layer marked near the base of the photo by the top of the scraper which is used for scale.
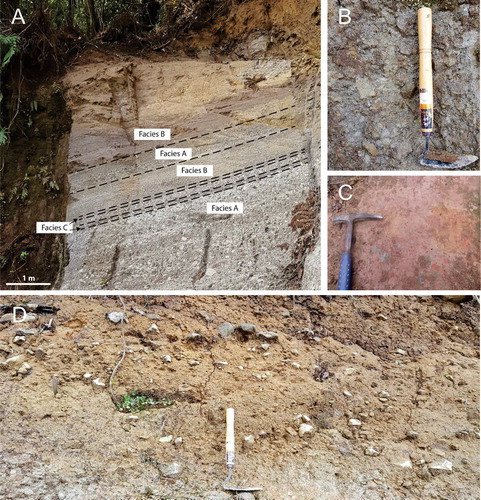
Table 2. Representative whole rock geochemical analyses by XRF and LA-ICP-MS for Maungatautari lavas.
Figure 8. Selected Harker diagrams for Maungatautari and Kairangi lavas.
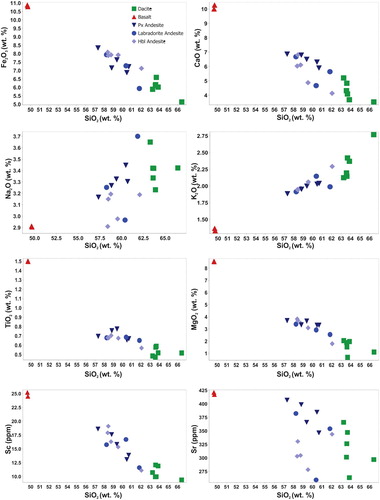
Figure 9. Mg# versus silica for Maungatautari and Kairangi lavas.
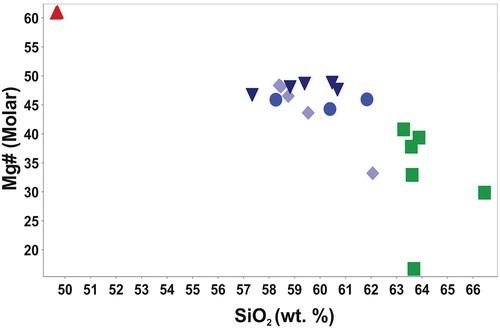
Figure 10. Primordial mantle normalised multi-element diagram for representative Maungatautari and Kairangi lavas. Normalisation factors after Taylor and McLennan (Citation1985).
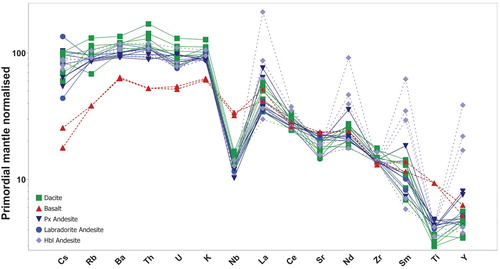
Figure 11. NMORB normalised REE diagram for representative Maungatautari and Kairangi lavas. Normalisation factors after Sun and McDonough (Citation1989).
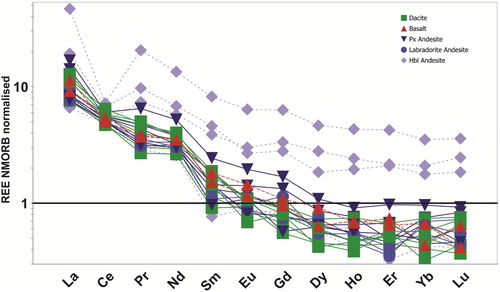
Figure 12. Radiogenic Sr and Nd isotopic compositions of representative Maungatautari and Kairangi lavas compared with Ruapehu andesites and basalts (Waight et al. Citation1999; Price et al. Citation2012), Coromandel Volcanic Zone (Huang et al. Citation2000), Mt Taranaki (Price et al. Citation1999), Alexandra Volcanics and Okete Volcanic Group (Briggs and McDonough Citation1990). Data for the regional basement terrane (Price et al. Citation2015) and MORB lavas (Ito et al. Citation1987) are also included for reference.
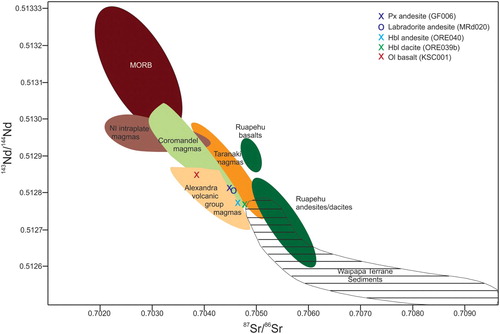
Figure 13. Primordial mantle normalised multi-element diagram for averaged geochemical data from the Coromandel Volcanic Zone (Booden et al. Citation2012), Kiwitahi (Booden et al. Citation2010), Ruapehu (Price et al. Citation2012), Alexandra (Briggs and Goles Citation1984; Briggs Citation1986b) and Taranaki (Price et al. Citation1999) volcanic centres and the Okete intra-plate volcanics of the western North Island (Briggs and McDonough Citation1990). Normalisation factors after Taylor and McLennan (Citation1985).
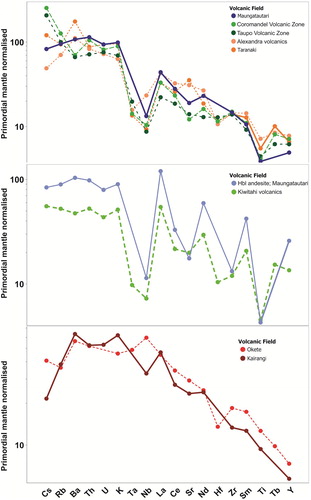
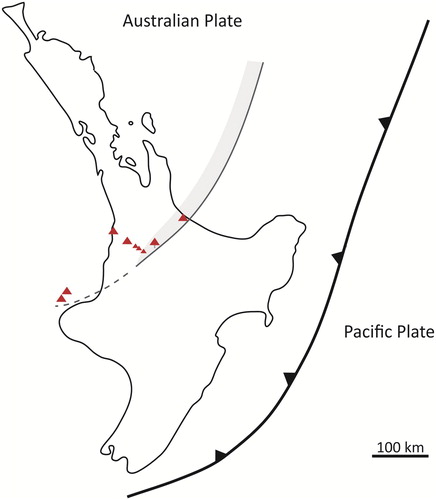
Figure 14. Schematic map showing the estimated position of the volcanic arc at c. 2 Ma and its propagation through the western North Island to include Maungatautari. Active volcanic centres are shown by red triangles. The continuation of the arc to include the western Taranaki Graben Volcanoes (dashed line) remains speculative.