Figures & data
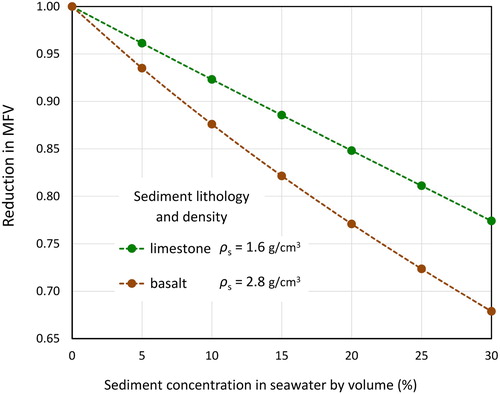
Figure 1. Sampling and measurement of coastal boulder fields: reef-derived carbonate clasts near Chaweng, Ko Samui island, southern Thailand (above), and large clasts of volcanic breccia and limestone on Ludao island, SE Taiwan (below).
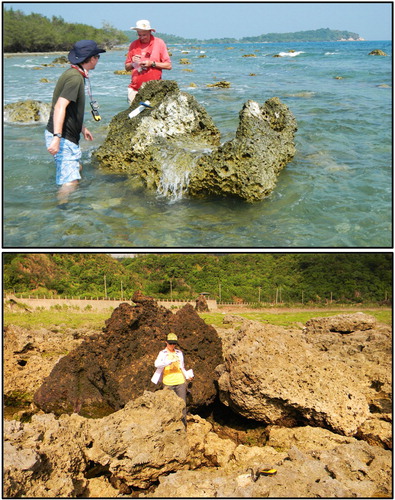
Table 1. Parameters in the widely-used hydrodynamic flow transport equations for transport initiation of coastal boulders.
Figure 2. Three simplified variations of an incoming flow stream with different distributions of sediments, as represented by black dots. Side views are shown. (a) A homogenously mixed flow stream where the sediment content is evenly distributed. (b) A depth-gradient where gravitational effects give higher sediment concentrations in the lower layers of the flow than the uppermost layers. (c) An unevenly mixed flow stream with a densely concentrated area at the top left ‘corner.’
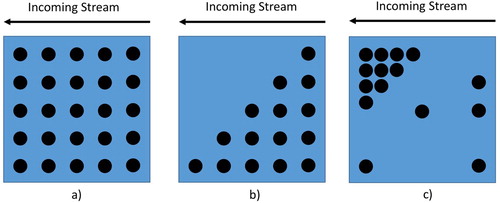
Figure 3. Values of the mixed-fluid density coefficient (Cρ) for a flow stream of seawater containing suspended sediment, according to sediment concentrations and sediment (grain) density, based on equation (5).
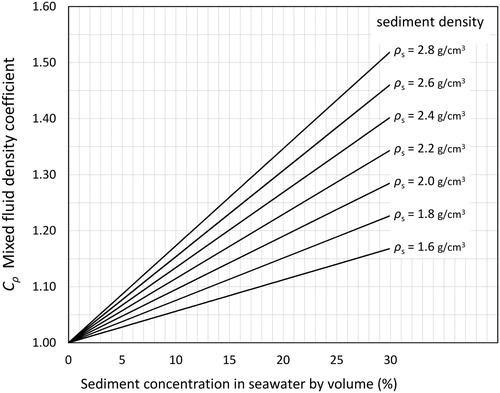
Table 2. Relationships between the concentration of example types of sediments in seawater and the resulting density of the seawater and sediment mix (ρm), based on equation (4).
Figure 4. Reduction in the minimum flow velocity (MFV) required for coastal boulder transport in a fluid mixture of seawater and sediment. The MFV is expressed as a fraction of the MFV calculated for clear seawater without suspended sediment. Two examples are given for coastal boulders of different lithologies: limestone and basalt. The sediments entrained in seawater are assumed to have the same lithology as the coastal boulders. The graphs apply to any mode of boulder transport – sliding, rolling or lifting.