
Figures & data
Figure 1. Metamorphic grades within the Otago Schist, with the studied sample site (Ram Rock) located in the highest-grade belt of upper greenschist facies. Diagram is modified from Wellnitz et al. (Citation2019).
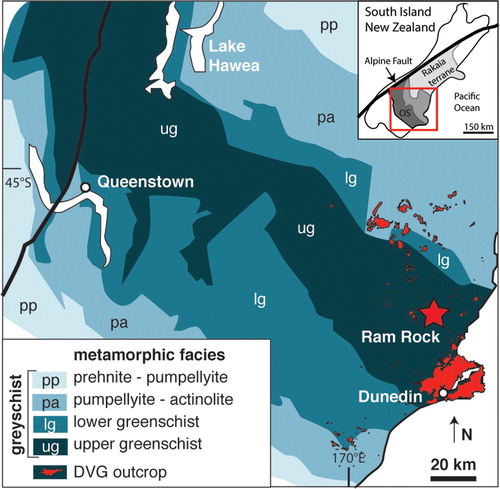
Figure 2. A, Ram Rock is a columnar-jointed basanite plug that hosts crust and mantle xenoliths. B, This schist xenolith in the basanite displays dark mafic domains and yellow felsic domains. Purple layers are cordierite. C, Crustal xenolith in outcrop of the basanite. Coin is 26.5 mm. D, Sample of the regional Otago Schist collected from near to the basanite outcrop. E, Outcrop of basanite with a small peridotite xenolith and small crustal xenolith. Coin is 26.5 mm.
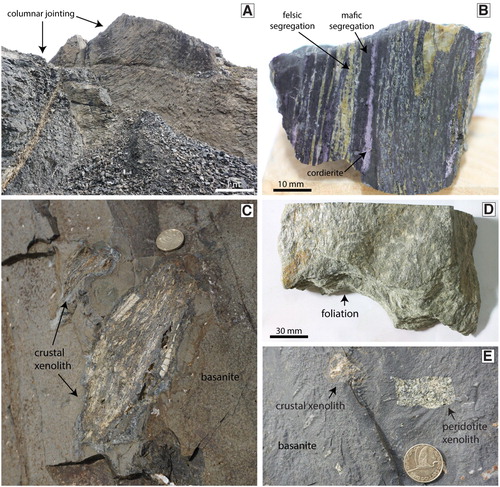
Table 1. Representative analyses of mineral geochemistry from Otago Schist and crustal xenolith samples.
Figure 3. Total alkali versus silica (TAS) classification diagram of Le Maitre et al. (Citation2005). The host lava plots as a basanite (Reay et al. Citation1991; Scott et al. Citation2020; this paper). Glass compositions from the different segregations of the xenoliths plots in three clusters that display little overlap. Glasses within the felsic domains have sub-alkaline compositions while glasses from the mafic domains and xenolith-basalt interface display alkaline compositions. The Dunedin Volcanic Group field is based on compiled data from Price et al. (Citation2003), Hoernle et al. (Citation2006), Sprung et al. (Citation2007), Timm et al. (Citation2010) and Scott et al. (Citation2020).
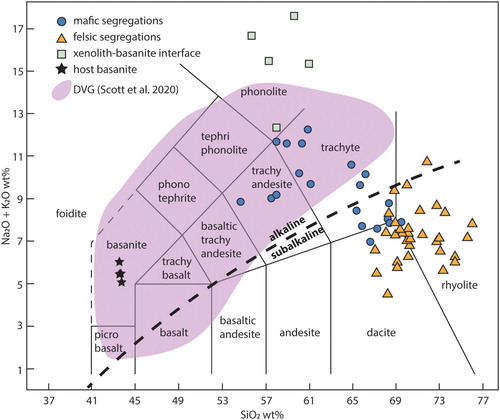
Figure 4. Multi-element plot of measured Ram Rock basanite and an Otago Schist xenolith with two samples of basanite at varying distances from an Otago Schist xenolith.
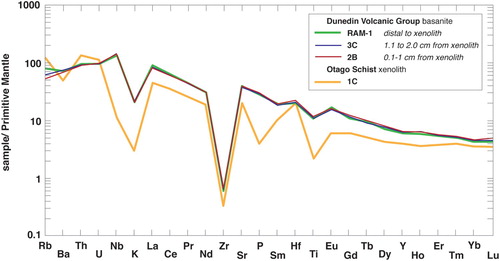
Table 2. Whole rock geochemistry and Sr-Nd-Pb isotopic analyses for Ram Rock basanite samples and an Otago Schist xenolith.
Figure 5. A, Photomicrograph in plane polarised light (PPL) of a garnet-bearing sample of Otago Schist collected near Ram Rock. B, Photomicrograph in PPL of a felsic domain in one of the collected Ram Rock crustal xenoliths. Quartz has lobate boundaries and a dark corona. Glass is heterogeneous in colour, ranging from colourless to a dark brown. C, Backscattered electron (BSE) image of skeletal orthopyroxene grains within glass in a felsic layer. D, Photomicrograph in PPL of a mafic domain in one of the collected Ram Rock crustal xenoliths. The mafic segregations are heterogeneous with a variety of minerals that are too small for optical identification. Glass varies from a medium brown to a dark brown/black colour. E, BSE image of plagioclase grains with a rectangular prismatic crystal shape. This morphology of plagioclase is always found within glass in the mafic layers. F, Inverted BSE image of a zoned anhedral plagioclase grain. Zoned plagioclase grains in the studied xenoliths consistently have a Ca-rich core and Na-rich rim. mus = muscovite, chl = chlorite, grt = garnet, qtz = quartz, opx = orthopyroxene, plag = plagioclase, dv glass = devitrified glass.
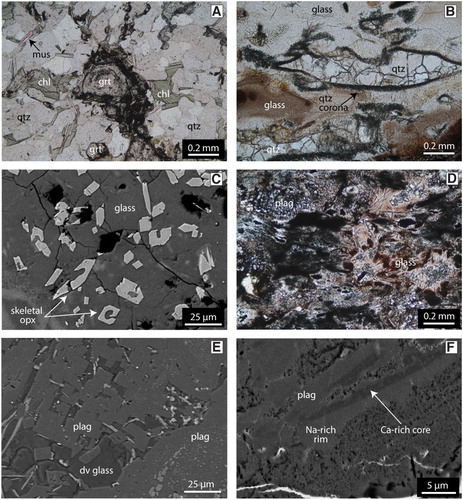
Table 3. Representative geochemical analyses of glasses within the crustal xenoliths. Glass was measured in both the felsic and mafic domains and from the basanite-xenolith interface.
Figure 6. Ternary feldspar diagram showing the wide variety of plagioclase compositions in the crustal xenoliths in comparison to the pure albite of the Otago Schist protolith. Plagioclase with a prismatic morphology tends to have an andesine composition while anhedral plagioclase is comparatively enriched in Ca. Considerable overlap in the plagioclase chemistry is present between the different plagioclase morphologies. Feldspar isotherms are from Benisek et al. (Citation2010).
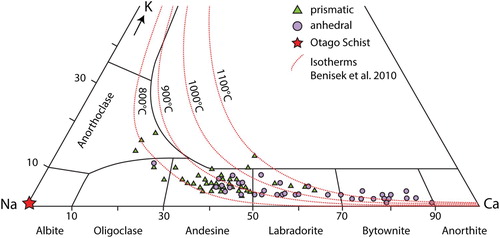
Figure 7. A, BSE image of cordierite in a mafic segregation with angular grain boundaries. Cordierite is typically found with a rectangular to square crystal morphology and hosted in glass. B, BSE image of an olivine-spinel symplectite. C, BSE image of cruciform and laddered olivine grains within devitrified glass. D, BSE image of a large symplectite composed of intergrown anorthite, ilmenite, olivine, and spinel with a rim of larger subhedral pigeonite grains. E, BSE image of an unknown mineral within the xenoliths. This mineral has an acicular morphology and can also be found as dendrites. F, BSE image of acicular SiO2 grains that have been identified at the xenolith-basanite interface. crd = cordierite, ol = olivine, spl = spinel, dv glass = devitrified glass, pig = pigeonite, ilm = ilmenite, an = anorthite, pl = plagioclase, un-id = unidentified mineral, qtz = quartz, cpx = clinopyroxene.
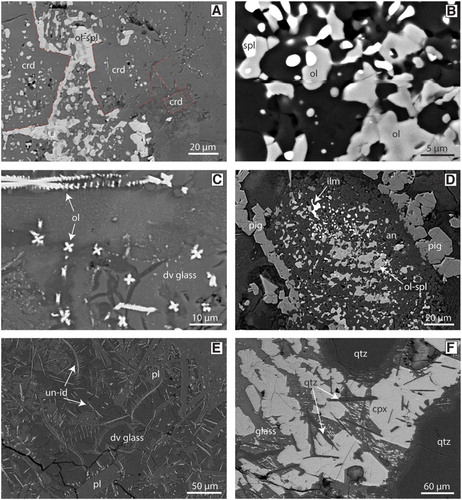
Table 4. Average values and the standard deviation for geothermometry of selected liquid-mineral pairs.
Figure 8. Distribution of misorientation angles of analysed quartz in an Otago Schist sample (A) and a crustal xenolith (B). The peak of ∼60° represents the dauphine twins. A higher relative frequency of dauphine twins is present in the crustal xenolith (0.26) in comparison to the Otago Schist (0.18).
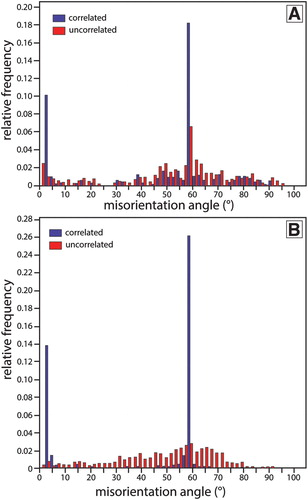
Figure 9. A, Schematic diagram of the mineralogical and textural changes that the regionally metamorphosed Otago Schist underwent during pyrometamorphism. Not to scale. B, P-T-t diagram of regional metamorphism of the Otago Schist around 160–140 Ma, followed by the pyrometamorphic event at 16 Ma (Coombs et al. Citation2008). Pressure and temperature range of Otago Schist metamorphism from Mortimer (Citation2000). Entrainment of the crustal xenoliths occurred at a shallow depth, with peak metamorphism reached quickly before the xenoliths were erupted and cooled.
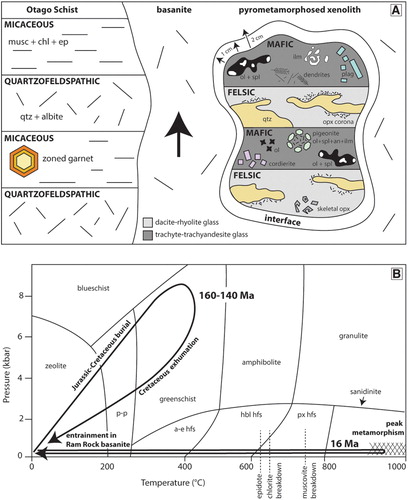
Table 5. Comparison of major element mineral chemistry of garnets from the analysed Otago Schist of a large anorthite-ilmenite-olivine-spinel-pigeonite symplectite in one of the crustal xenoliths.
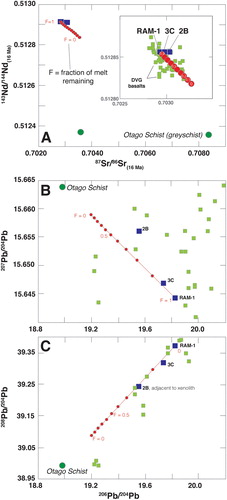
Figure 10. A, Plot of 143Nd/144Nd versus 87Sr/86Sr shows little isotopic change in the basanite samples within several cm from a crustal xenolith (2B, 3C). B, 207Pb/204Pb versus 206Pb/204Pb reveals variation in the basanite adjacent to the crustal xenolith, with the highest isotopic change occurring in the sample taken from closest to the xenolith. C, A similar trend to 10B is visible on a plot of 208Pb/204Pb against 206Pb/204Pb. The arrays represent the modelled fraction of melt remaining as the isotopic compositions evolve. The DVG basalts are from Scott et al. (Citation2020).
Data availability statement
The authors confirm that the data supporting the findings of this study are available within the article.