
Figures & data
Figure 1. (a) Basement terrane map of New Zealand showing the Eastern and Western provinces, Paparoa Metamorphic Core Complex, and the Paparoa Basin at the southern end of the core complex. Inset shows New Zealand’s North and South islands within Zealandia. (b) Oligocene Challenger Rift System through western New Zealand with outline of present shoreline and strike of future Alpine Fault for reference (modified from Kamp Citation1986a); also shown are rotation poles at 40 and 30 Ma according to King (Citation2000) and the Paparoa Trough.
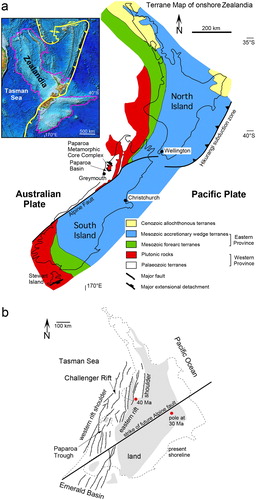
Figure 2. Tectonic map of the Paparoa Metamorphic Core Complex (modified from Nathan et al. Citation2002) showing the mid Cretaceous Ohika and Pike low-angle detachment faults, NNE-striking high-angle normal faults and shallower dipping Lower Buller and Maimai reverse faults (after Seward and White Citation1992; Ghisetti and Sibson Citation2006; Schulte et al. Citation2014). Map coordinates refer to New Zealand Map Grid which uses the New Zealand Geodetic Datum 1949.
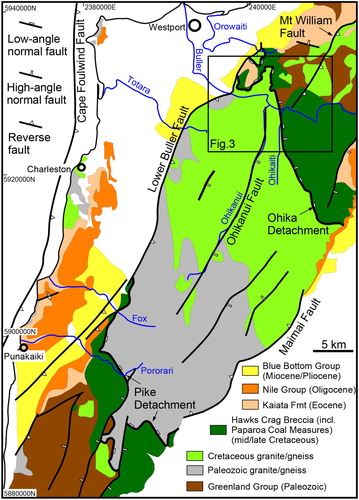
Figure 3. New Zealand 8-m digital elevation model (DEM) (data.linz.govt.nz/layer/768) of western Lower Buller gorge showing the fault pattern, the locality of sample PCC17-12 (black star) and the sites where the photos in were taken. Black arrows with white arrow heads indicate mid/Late Cretaceous subhorizontal extension directions on low-angle Ohika Detachment; red arrows show sub-horizontal extension directions for NNE-striking high-angle normal faults and blue arrows indicate subhorizontal shortening directions for Miocene to Recent reverse faults. Note two types of ticks on Ohikaiti Fault illustrating normal reactivation of former low-angle detachment fault. (a-k) Fault-slip data. Diagrams show fault-plane great circles, poles for striations on the fault planes, arrows indicating hanging-wall slip direction, and principal strain axes (X > Y>Z). Note that the data were collected from scattered outcrops within an approximately 0.2–0.3 km2 area indicated by the yellow polygons (the size of the polygons crudely reflects the area of observations). (a, b) Mainly shallowly NE-dipping fault planes with NNE-plunging striae providing NNE-SSW extension direction for the Ohika Detachment. (c-g) Sets of steep, about N-S-striking, conjugate normal faults indicative of WNE-ESE extension. (h-k) Mainly NNE-striking moderately to steeply dipping reverse faults proving WNW-ESE-trending shortening direction. Map coordinates refer to New Zealand Map Grid which uses the New Zealand Geodetic Datum 1949.
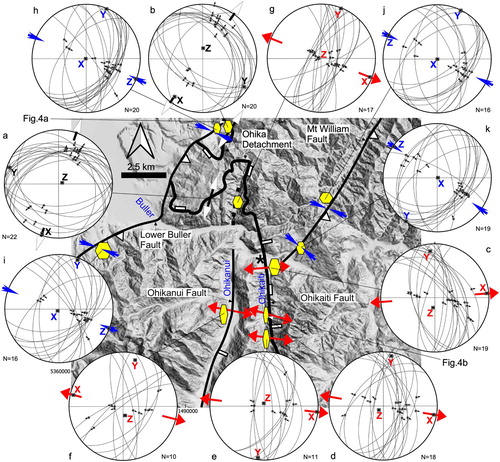
Figure 4. Outcrop photos of slickenside kinematic indicators. (a) Annotated fault surface with shallowly plunging slickensides in Buckland granite in the upper Orowaiti River. The various kinematic indicators and their interpretation are after Doblas (Citation1998). (b) Steeply plunging striations in Buckland Granite in Ohikaiti valley. Note very fine-grained (blackish) fault surface with pluck marks (for localities from where pictures are taken see ).
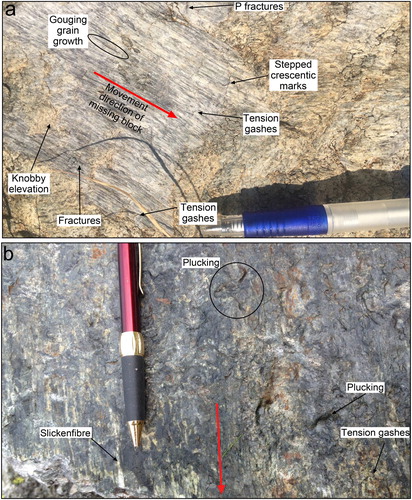
Figure 5. K-Ar ages of four grain-size fractions versus their proportion of 2M1 illite/muscovite for sample PCC 17–12 (see also ). The relationship between K-Ar age and the 2M1 polytype is well-described by the linear regression (red line) with an upper-intercept age of 103 ± 3.5 Ma and a lower-intercept, gouge-formation age of 35.2 ± 2.3 Ma (1σ errors; note that the errors on the four ages for the various grain-size fractions are 2σ errors). The shaded areas either side of the red line show 68% confidence intervals (York et al. Citation2004; Vermeesch Citation2018).
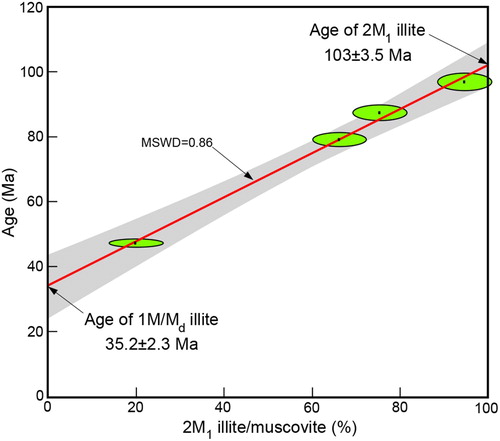
Table 1. K-Ar and XRD data for four grain-size fractions used for fault-gouge dating.
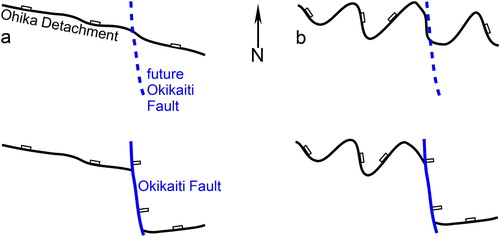
Figure 6. Two possible map interpretations for latest Eocene normal faulting in the Lower Buller gorge. (a) Relatively straight, approximately WNW-striking Ohika Detachment that was not favourably oriented for late Eocene WNW-ESE extension cut and downfaulted by the new Ohikaiti Fault. (b) WNW-striking Ohika Detachment that was folded about NNE-trending axes during mid/Late Cretaceous low-angle extensional shearing. The Ohikaiti Fault formed along one of the fold limbs favourably oriented for Eocene ENE-directed extension.
Data availability statement
The supplementary data are openly available at https://doi.org/10.5281/zenodo.3970805.