
Figures & data
Figure 1. Location maps for this study (A) Location in the Otago Schist belt. (B) Hillshade digital elevation model (DEM) image of the Glenorchy area, showing topography, drainage, and locations of principal mined areas (size exaggerated for clarity). Summary As concentrations in water, rocks and soils are indicated (see text for references).
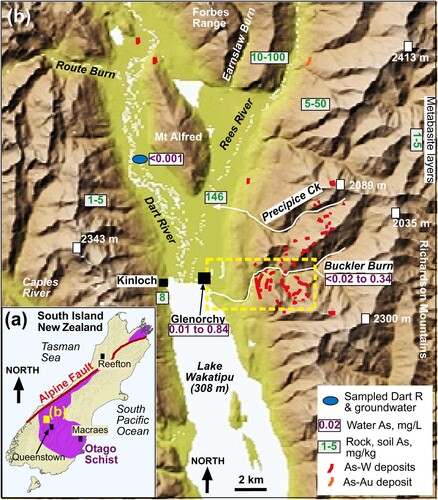
Figure 2. Summary of features in the Frankton area relevant to As mobility and enrichment. (A) DEM of the Queenstown district, showing general location of Wakatipu shallow groundwater aquifer (Rosen and Jones Citation1998) and Frankton. (B) As concentrations in Wakatipu aquifer groundwaters, summarised from ORC (Citation2021). (C) As concentrations in Frankton substrates, summarised from QLDC(2016). (D) Photograph of excavated section through substrate near top of Frankton terrace, with summary of fp-XRF As analyses (mg/kg) at different levels. (E) Active deposition of ferric oxyhydroxide, with adsorbed As (mg/kg; fp-XRF analysis summary), from groundwater seep at bottom of Frankton terrace.
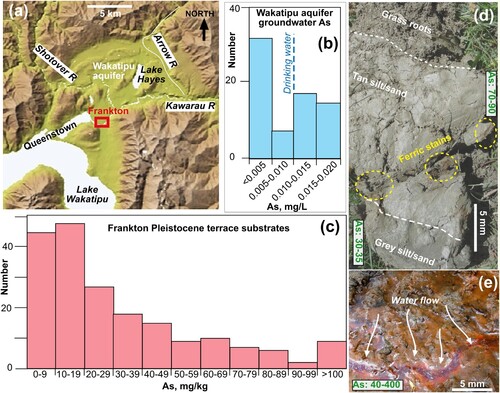
Figure 3. Validation and calibration of fp-XRF analysis; see text for references. (A) Background As and Fe concentrations in Otago Schist and schist-derived colluvium near Macraes in east Otago (A). (B) Calibration over 5 orders of magnitide of fp-XRF As analyses compared to lab-derived XRF data for same dried samples.
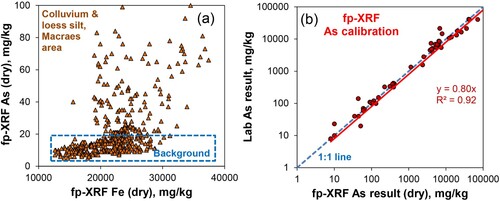
Figure 4. Typical mineralogical and textural distribution of As-bearing sulfides in schist samples relevant to this study. (A) Sketch of pyrite and cobaltite in sub-greenschist Caples Terrane rock (after Pitcairn et al. Citation2010). (B) Close view of foliation surface of a sub-greenschist facies pelitic schist from an outcrop in Forbes Range (OU 42272). Brown spots indicate incipient oxidation of pyrite within the foliation. (C) Cobble of Forbes Range sub-greenschist facies schist from Earnslaw Burn, showing oxidation spots for pyrite in cross-cutting metamorphic quartz veins. (D) Broken section through a cobble of well-segregated greenschist facies schist from Richardson Range. Brown spots (yellow arrows) indicate pyrite oxidation on foliation, and in foliation-parallel deformed quartz veins (top).
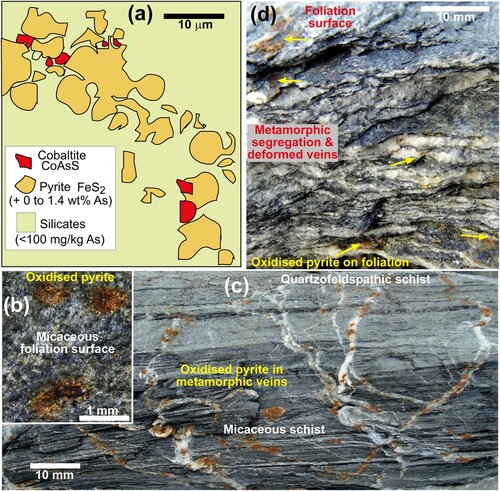
Table 1. Arsenic and metal concentrations (mg/kg) in soils and rocks relevant to this study.
Table 2. Water analyses for the Buckler Burn catchment (a) compared to Dart River background.
Figure 5. Arsenic and Fe analyses (fp-XRF) of solid materials on Glenorchy delta and nearby mountains. (A) Sandy silt from exposed portions of active river beds, and soil on fans near Kinloch (B). (B). Rocks from Forbes and Richardson Ranges, from outcrop and stream cobbles. Several analyses were done on different surfaces of some rocks. (C) Analyses as in b for rocks from outcrops on Forbes Range. (D) Analyses as in b for rocks from outcrops on Richardson Range. (E) Analyses of shallow soils (upper 15 cm) from Lower Rees valley on Glenorchy delta (B). Data for deeper soil profiles (as in f) are also plotted. (F) Variations of As with depth for two soil profiles (A–C) in the lower Rees valley, with generalised envelope indicating surface enrichment.
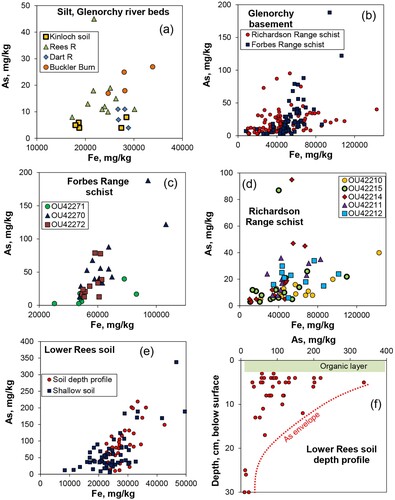
Figure 6. Photographs of soil profiles from lower Rees valley, with As analyses (E,F). (A) Profile with transition from oxidised (brown, top) to low-oxygen (grey, bottom) environments, and summaries of As concentrations (mg/kg). (B) Profile with sharp redox boundary (yellow dashed line) between oxidised (top) and low-oxygen environments, with As spot analyses (mg/kg). (C) Close view of central portion of b, showing patches of ferric staining. White sheen shows prevalent mica flakes.
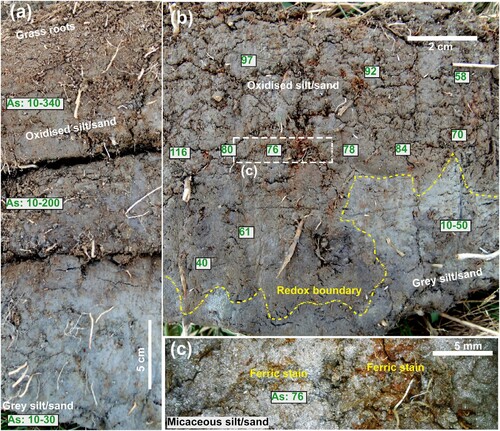
Figure 7. Relations between As and W at mine sites. (A) Bulk analyses of As and W at Macraes mine (MacKenzie et al. Citation2017), paragenetically similar to Glenorchy mineralisation system. (B) Portion of a typical scheelite-bearing vein from Glenorchy, with an As-rich selvedge. (C) Perpendicular view of the As-bearing selvedge in b. A = arsenopyrite. (D) Close view of relatively coarse sulfides in the selvedge in c. A = arsenopyrite; P = pyrite. (E) Glenorchy State mine waste rock pile dominated by unmineralised schist debris. (f) Bonnie Jean mine waste rock pile, with fp-XRFAs analyses. Paler portions are quartz-rich debris.
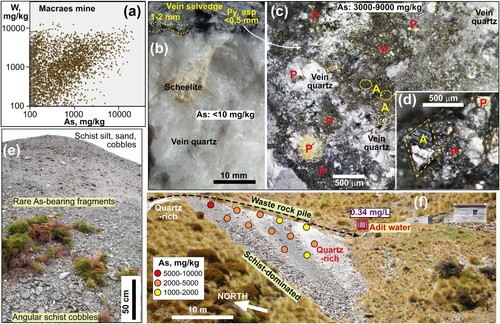
Figure 8. Buckler Burn mine sites. (A) General map of the catchment, showing locations of waste rock piles (summarised from GoogleEarth), and As water concentrations at sampled sites (). (B) Map and As concentrations of tailings pile at the Glenorchy State mine processing plant. (C) Oblique photograph of map view in b. (D) Excavated depression in tailings to reach As-rich material beneath quartz-rich surface.
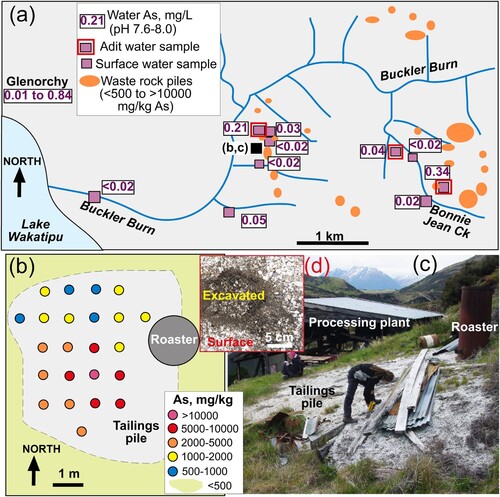
Figure 9. Chemistry of Buckler Burn waters () compared to other relevant waters (see text for references). (A) Na versus Cl, showing deviation from marine aerosol composition (blue line). (B) Ca versus alkalinity, showing strong relationship between water compositions and calcite dissolution (brown line). (C) Mg versus sulfate, showing deviation to higher sulfatefrom marine aerosol compositions (blue line). (D) Electrical conductivity (EC) versus pH, showing generally higher pH and lower EC in Buckler Burn. (E) Comparison of pH and dissolved As for Buckler Burn and Macraes mine waste rock discharge waters. (F) Comparison of pH and dissolved As for Buckler Burn waters with Macraes mine tailings waters, and waters derived from experimental leaching of arsenopyrite-rich rock (ore from Reefton; a; Kerr et al. Citation2015).
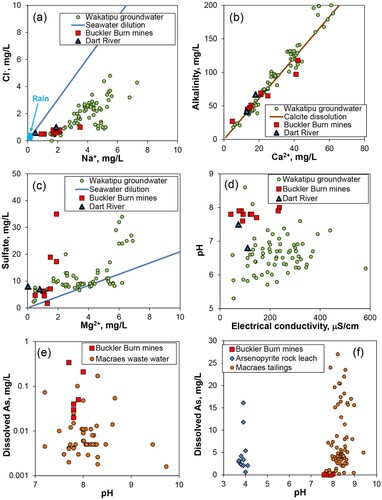
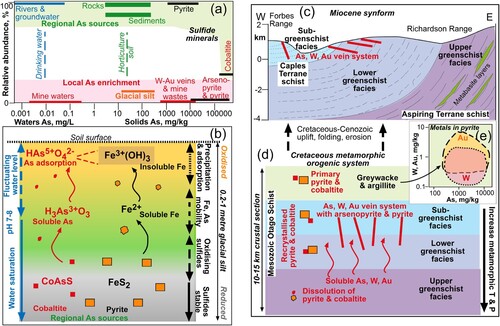
Figure 10. Summary of geogenic As mobilisation and concentration processes relevant to Glenorchy area. (A) Comparisons of principal As concentrations in solid materials, and their relative proportions, for regional geogenic processes and mine sites. (B) Sketch section through soil and underlying fresh schist-derived sediment, showing the principal variations in oxygen contents that control As and Fe mobility in shallow groundwater. (C) Sketch composite cross section from Richardson Range to Forbes Range, showing the present geological structure, with mineralised veins cutting a Mesozoic metamorphic transition that was subsequently folded into a synform in the Miocene. (D) Reconstruction of a Mesozoic crustal metamorphic section, showing Cretaceous mineralisation processes. (E) Arsenic, Au and W in sub-greenschist facies pyrite in the Otago Schist belt that is a precursor to the mineralisation system (Large et al. Citation2012).
Data availability
All data relevant to this study are included within this paper and within cited references.