
Figures & data
Figure 1. Location of the study area in northeastern South Island, NZ, showing geographic localities and geological features discussed in the text. Faults are shown as solid black lines, and key faults of the Marlborough fault system are labelled. Red polygons indicate areas shown in detail in (A = Coverham, B = Kekerengu, C = Wharekiri, respectively). The ‘middle Clarence’ moniker denotes areas of the Clarence valley lying south and southwest of Tapuae-o-Uenuku (e.g. Reay Citation1993). The grid is the NZ Transverse Mercator 10-kilometre grid. The geology is simplified from Rattenbury et al. (Citation2006). Inset shows the location within NZ and key faults of the Australia/Pacific plate boundary, including those of the Marlborough fault system.
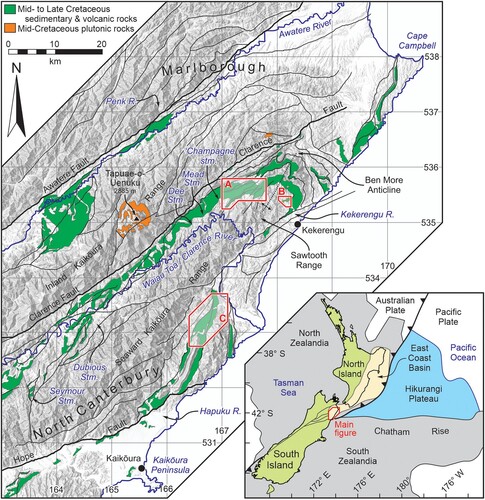
Figure 2. Lithostratigraphic nomenclature and rock relationships of Cretaceous units in the Clarence valley and immediate environs. Names in bold italics are units described here. Split Rock Formation is indicated in shades of green (Tentpoles Conglomerate, Miller Sandstone, Black Rock, Wharf Sandstone, and Swale Siltstone members). ‘Undifferentiated Split Rock Formation’ includes strata mapped previously as Ouse Member/Formation and Cold Stream Member (see text). Red lines within Bluff Sandstone and Nidd formations indicate minor occurrences of Gridiron Formation volcanic rocks. Relationships for the middle Clarence area are modified from Reay (Citation1993). Age relationships for the Paton and Herring formations are simplified and adapted from Crampton et al. (Citation2000, Citation2006). The geological timescale is from Raine et al. (Citation2015). Group-level nomenclature is modified from Rattenbury et al. (Citation2006) and higher-level lithostratigraphic nomenclature follows Mortimer et al. (Citation2014).
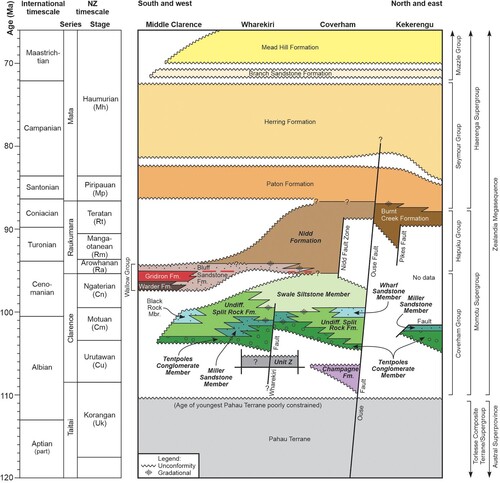
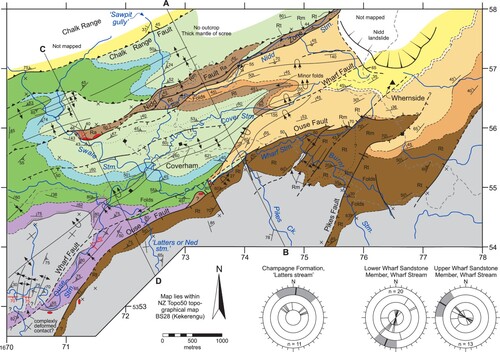
Figure 4. Geological map of the Kekerengu area (polygon ‘B’ on ). Geological symbols are explained in . The locations of measured sections are shown in Figure S2.
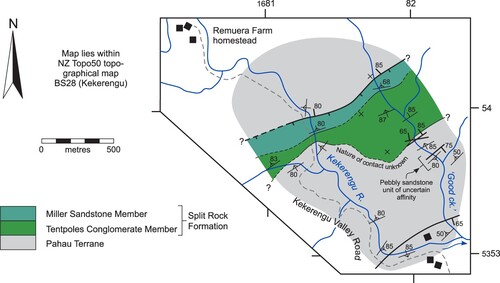
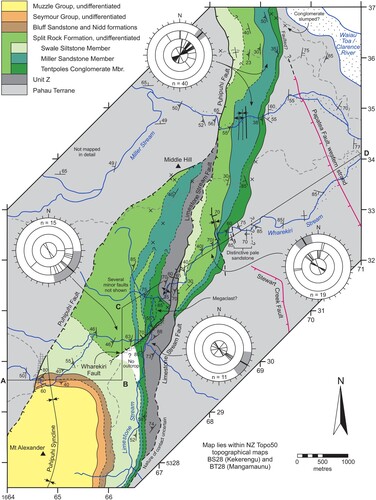
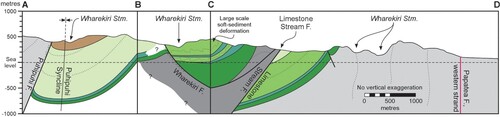
Figure 6. Stratigraphic architecture in the Coverham area, coloured to emphasise age and thickness relationships; lithostratigraphic units are indicated by overprinted patterns. Annotated and more detailed measured sections are given in Figures S4–S6 and, for Burnt Creek Formation, in Crampton and Laird (Citation1997). Note that the Urutawan and Motuan stages cannot be differentiated reliably (see text). In several places total thickness of units could not be logged in the field and, instead, thicknesses are estimated from the geological map (). For the purposes of this figure, it is assumed that the Champagne Formation is Korangan or older. The datum is the base of Haumurian Stage Herring Formation. Note that horizontal distances are indicative only.
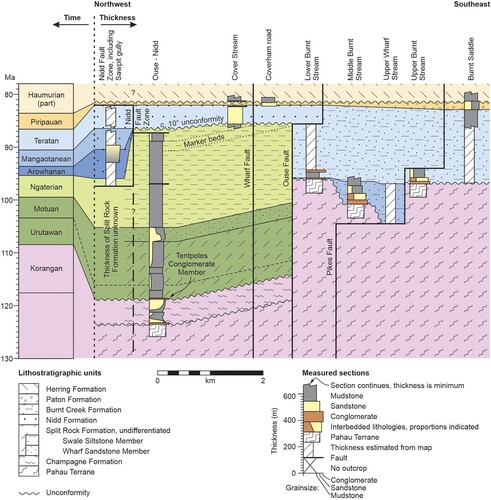
Figure 7. Photographs of representative outcrops of units described here; figure outlines for scale. A, Champagne Formation in Latters stream, Coverham (GR723545), showing sharp (erosive or slumped) contact between moderately deformed mudstone with thin-bedded sandstone (bottom right) and stratigraphically overlying, intensely deformed mudstone (top left). B, Undifferentiated Split Rock Formation in Wharekiri Stream (GR661304; c. 900 m in middle Wharekiri section, Figure S9A), showing c. 10 m-thick syn-sedimentary slump unit; strata young to the right. C, Tentpoles Conglomerate Member of Split Rock Formation, Wharekiri Stream (GR668306; c. 400 m in middle Wharekiri section, Figure S9A); relatively coarse-grained and clast-rich end-member. D, Wharf Sandstone Member of Split Rock Formation, Wharf Stream, Coverham (GR726551); note conspicuously bimodal sandstone bed thickness; strata young to the right. E, Swale Siltstone Member of Split Rock Formation, Cover Stream, Coverham (GR728559), showing relatively homogenous mudstone with scattered, large concretions and thin sandstone beds; sandstone beds close to the top of the outcrop are offset by a small fault, but also pinch out towards the northeast (right, see Figure S14H); exposure c. 50 m high. F, Nidd Formation, type section in Sawpit gully, Coverham (c. GR726566, Figure S2; upper parts of the northern and southern sections of Figure S4); outcrop comprises more-or-less muddy, very fine sandstone to coarse siltstone, with scattered concretions and highly fossiliferous concretionary beds; figures circled for scale.
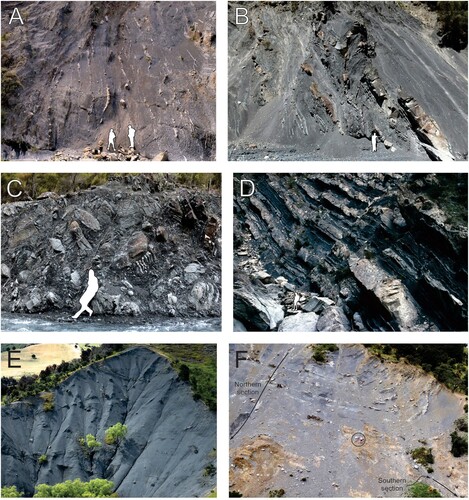
Figure 8. Stratigraphic architecture in the Wharekiri area, coloured to emphasise age and thickness relationships; lithostratigraphic units are indicated by overprinted patterns. Annotated and more detailed measured sections are given in Figures S7–S10. Relatively sparse paleontological data mean that that placement of the Motuan/Ngaterian boundary is approximate only and the Urutawan and Motuan stages cannot be differentiated (see text). In the south, the datum is the base of Haumurian Stage Herring Formation; in the north, sections are levelled on the top Tentpoles Conglomerate Member. Note that horizontal distances are indicative only.
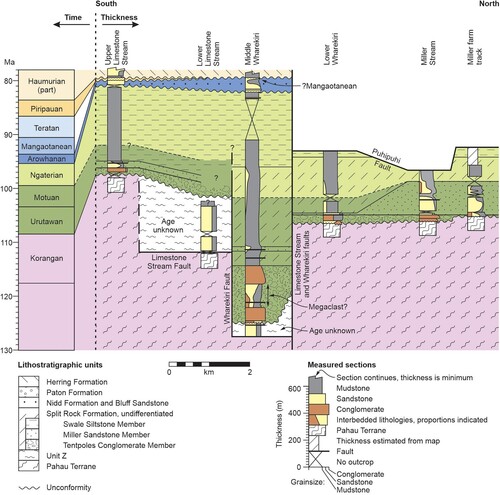
Figure 9. Cartoon to illustrate the inferred Cretaceous geological history recorded at Coverham. Stratigraphy is coloured by formation and colours match and . These reconstructions take no account of likely Cenozoic shortening across some of these faults. Relative thicknesses of formations and relative water depths are indicative only. In panels A and B, thickening of units towards the Ouse Fault is speculative. In panels B and C, deposition of Split Rock Formation to the southeast of Ouse Fault and subsequent uplift and erosion of these strata is based on evidence from the Wharekiri and Kekerengu areas. In panels D and E, age relationships within Nidd and Burnt Creek formations are indicated using stage symbols (Ra = Arowhanan, Rm = Mangaotanean, Rt = Teratan).
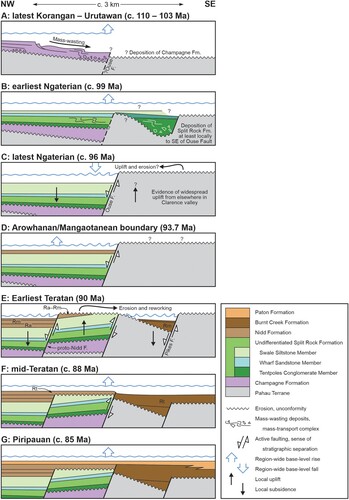
Figure 10. Cartoon to illustrate the inferred Cretaceous geological history recorded at Wharekiri. Stratigraphy is coloured by formation and colours match and , except that Pahau Terrane and Unit Z are not discriminated here. Relative thicknesses of formations and relative water depths are indicative only.
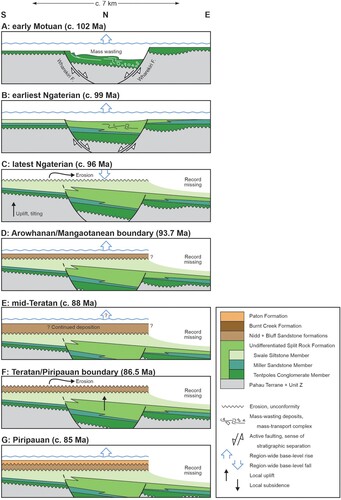
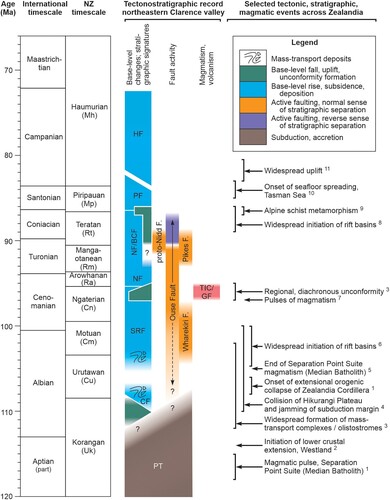
Figure 11. Summary of Cretaceous tectonic and stratigraphic signals observed at the northeastern end of the Clarence valley, and comparison with selected regional tectonic, stratigraphic, metamorphic and magmatic events from across Zealandia, compiled from the literature. BCF = Burnt Creek Formation, CF = Champagne Formation, GF = Gridiron Formation, HF = Herring Formation, NF = Nidd Formation, PF = Paton Formation, PT = Pahau Terrane, SRF = Split Rock Formation, TIC = Tapuaenuku Igneous Complex. References: 1, Schwartz et al. (Citation2016); 2, Klepeis et al. (Citation2007); 3, Crampton et al. (Citation2019), and see text; 4, Davy (Citation2014), Reyners et al. (Citation2017), Mortimer et al. (Citation2019); 5, Schwartz et al. (Citation2017); 6, Strogen et al. (Citation2017), Raine et al. (Citation2018), Barrier et al. (Citation2020); 7, Tulloch et al. (Citation2009), Hoernle et al. (Citation2020); 8, Strogen et al. (Citation2017), Raine et al. (Citation2018); 9, Vry et al. (Citation2004), but see Briggs et al. (Citation2018); 10, Laird and Bradshaw (Citation2020), and references therein; 11, Strogen et al. (Citation2017).
Data availability statement
A file containing supplementary data, descriptions, figures and reasoning in support of this paper is available in figshare via https://doi.org/10.6084/m9.figshare.22290778. All paleontological data used in the study are lodged in the New Zealand Fossil Record File (Clowes et al. Citation2020), accessible at https://fred.org.nz/.