
Figures & data
Figure 1. Location hillshade DEM maps (geographx.co.nz) for aspects of this study, with transport directions for detrital gold. A, Topography of the Southern Alps in South Island of New Zealand. B, Oblique view from northwest of a portion of the Southern Alps goldfield, showing the topographic setting of beach placers. C, Map view of the northern portion of Southern Alps goldfield with the location of principal samples examined in this study in Late Pleistocene-Holocene beach placers near Lake Mahinapua. D, Map view of southern South Island showing topography on the southeast side of Southern Alps in the Otago and Southland goldfields and Cenozoic transport of gold to south coast beach placers.
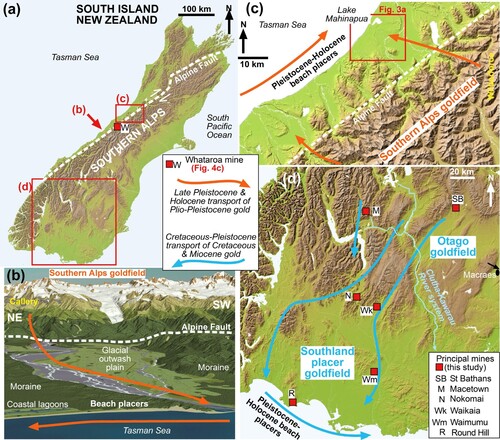
Figure 2. Typical gold compositions in Otago and Southland goldfields compared to Southern Alps. A, Plot of Ag versus Hg for orogenic gold in Otago (data replotted from MacKenzie and Craw Citation2005), with range for Southern Alps (red dashed box; Hg <1 wt%). B, SEM backscatter image of Southland Pleistocene fluvial gold (etched with aqua regia) overlain with Au map (left) and combined Au and Ag maps (right), showing red Ag-rich etching residues. Modified from Craw et al. (Citation2017). C, Silver content of bulk gold bars produced at Waikaia mine, Southland goldfield (D), in a Pleistocene paleochannel. Data replotted from Craw et al. (Citation2017). Ag content decreased over 2 km down the paleochannel. D, Range of Ag and Hg in placer gold from Nokomai mining area in Southland placer goldfield (D). Data summarised from Youngson et al. (Citation2002). E, Ag contents of beach gold particle cores on the south coast of Southland placer goldfield (Round Hill mining area; D). Data replotted from Mitchell (Citation1996).
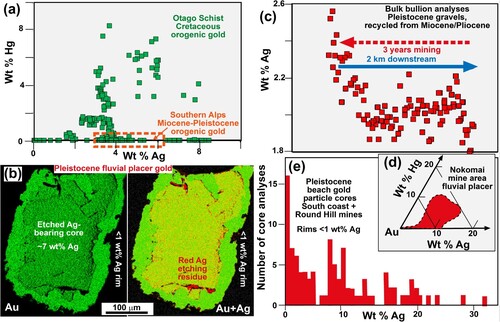
Figure 3. Location and geological setting for Southern Alps Late Pleistocene-Holocene beach gold sample sites near Lake Mahinapua (C). A, Map of landscape features around the sample sites, with moraine distribution from Nathan et al. (Citation2002). B, Modern storm-eroded cliff section (site shown in a) through beach sediments including several heavy mineral layers. C, Total magnetic intensity (TMI) survey map (relative scale) of inland beach sands in the area for which samples were taken for this study. Heavy mineral concentrates with magnetite (and gold) are indicated in red-orange colours.
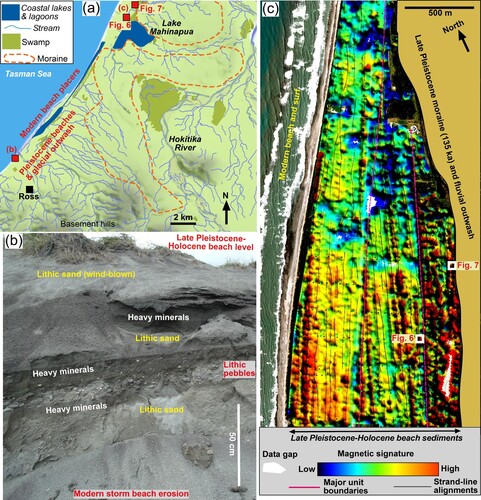
Figure 4. Geological features of the active components of Southern Alps goldfield. A, An example of source area (Callery valley; B) for erosion of Plio-Pleistocene orogenic gold from uplifted schist basement. B, Example of eroded orogenic gold in a quartz vein cobble. C, Coarse fluvial gold from a small mine located at the break in slope immediately upstream of Alpine Fault (Whataroa River; A). Some particles retain remnants of host vein quartz (Qtz). D, Active beach placer concentrations of gold-bearing heavy mineral sands (dark streaks). E, Section through modern beach sand, showing several subsurface heavy mineral layers.
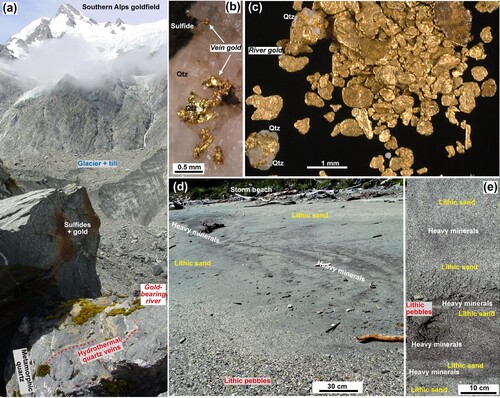
Figure 5. Late Pleistocene-Holocene beach sediments were excavated ∼1 km inland from the modern shoreline for extraction of gold samples. A, Excavation wall in beach sands near sample site, showing truncated heavy mineral layers. B, Close view of an excavation wall in beach sands (as in a) showing heavy mineral layers. C, An excavation site in beach sands at foot of moraine deposit (A,C). D, Close view of basal heavy mineral layers in c, from which gold in was extracted.
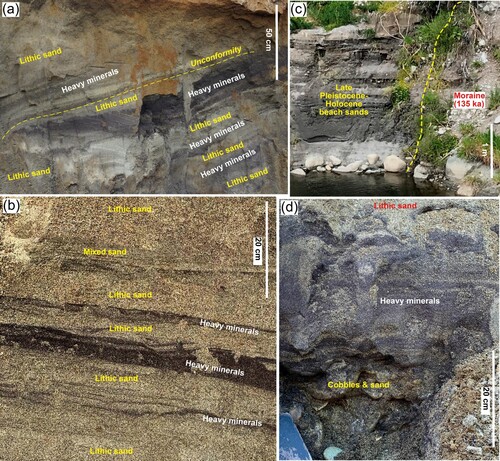
Figure 6. SEM backscatter images of beach gold extracted from exploration bulk sample near Lake Mahinapua (C; A,C; A,B). A, General view of gold shapes. B–E, Particles with remnants of orogenic crystalline gold forms. F–I, Irregular particles with variably deformed rough surfaces. J–M, Flakes with smoothed and deformed surfaces. The particle in l has embedded fine silicate clasts. N, Close view of a cavity in m, with a cluster of vermiform gold.
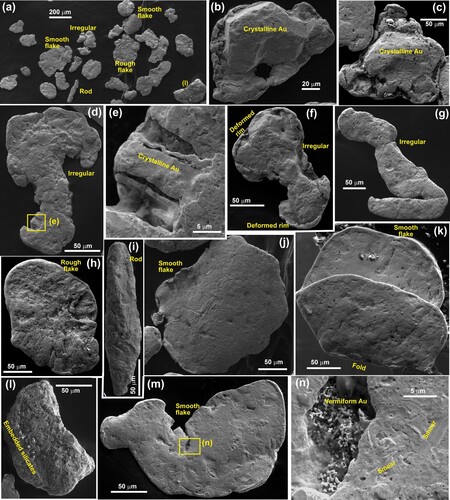
Figure 7. SEM backscatter images of beach gold panned from a heavy mineral concentrate near moraines at Lake Mahinapua (C; A,C; C,D). A, General view of gold shapes. B, Rounded particle with remnants of crystalline forms. C,D, Smoothed flakes. E–H,. Close views of flake surfaces with vermiform gold in depressions. I, J, Smooth flake with embedded silicate clasts (S), partially covered with smeared surface gold.
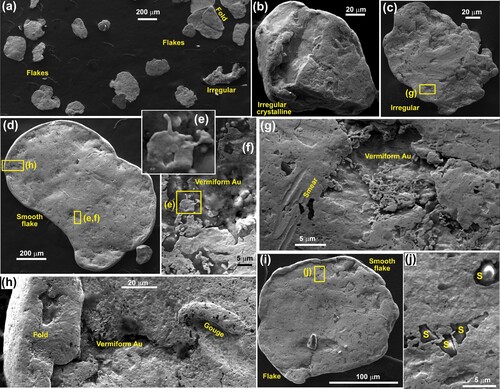
Figure 8. SEM views of the internal structure of an irregular Southern Alps beach gold particle. A, Backscatter electron image of surface etched with aqua regia but showing no contrasts in internal structure. B, Part of an image in B, overlain with Au and Ag element maps to show dominant Ag-bearing gold (green) and Ag-depleted gold on the upper margin (increasing red colouring). A portion of a coating of Ag-free vermicular gold occurs on the bottom side (red). C, EBSD IP view of the least-deformed, coarse-grained portion of the particle. D, EBSD crystallographic misorientation map of part of a large grain on particle margin in C. E, EBSD crystallographic misorientation map of moderately deformed part of a particle. F, EBSD IP view of the most-deformed and extended part of the particle. G, EBSD crystallographic misorientation map of part of the deformed extension in f.
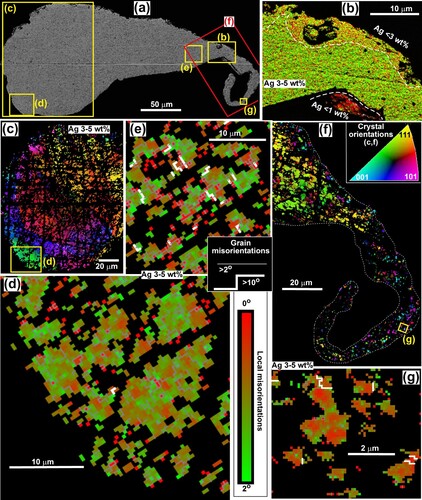
Figure 9. SEM views of the internal structure of a complexly folded Southern Alps beach gold flake. Legends are the same as in . A, Backscatter electron image of surface etched with aqua regia but showing no contrasts in internal structure. B, EBSD IP view across the particle. C, Close view of ribbon textured gold, as indicated in B. D, EBSD crystallographic misorientation map of part of the ribbon textured gold, as indicated in b. E,F, Parts of an image in A, overlain with Au and Ag element maps to show dominant Ag-bearing gold (green) and Ag-depleted marginal gold (increasing red colouring). A portion of a coating of Ag-free vermicular gold occurs on the top side of e (red).
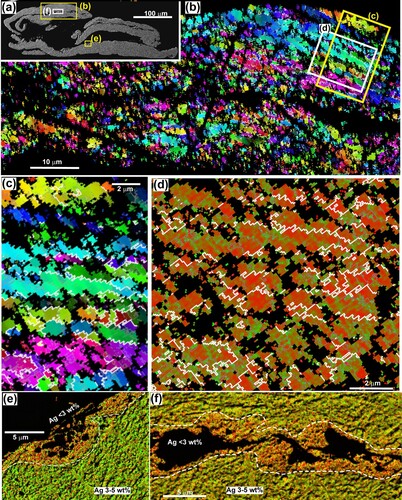
Figure 10. Evolution of fluvial placer gold particles in Otago and Southland goldfields. A, SEM backscatter image of an etched polished section through the edge of a particle of Otago Cretaceous fluvial gold, showing Ag variations. B, SEM EDS element map for Ag on a flat portion of the exterior surface of a Cretaceous particle. C, SEM backscatter image of the surface of Otago Eocene fluvial gold particle, with vermiform authigenic gold (left) and smeared gold (right). D, EBSD Euler colour map (modified from Kerr et al. Citation2017) of fine grains of the smeared gold surface, as in d. E, EBSD Euler colour map of a particle of Otago Miocene fluvial gold, with a yellow dashed boundary between Ag-bearing coarse-grained core and low-Ag fine-grained rim. F, Incident light view of etched gold from Pleistocene deposit (Waikaia mine; D) in Southland goldfield. Large particle has a deeply leached Ag-bearing core and prominent rim of low-Ag gold. G, EBSD IP view of grain structure in small particle in F, showing contrasts between core and rim. H, Incident light view of thin Ag-poor Southland flake with a small remnant of Ag-bearing core. I, Backscatter electron image of thin folded Southland flake with very small remnant Ag-bearing core.
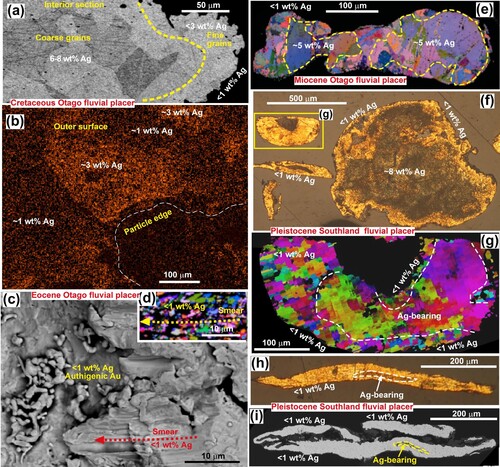
Figure 11. Microscopic views of the internal structure of Otago and Southland fluvial gold (etched with aqua regia), showing details of Ag leaching to leave Au-rich portions. A, Backscatter electron image of core grains of a particle, overlain with Au and Ag element maps to highlight Ag-poor (red; high relief) grains that have formed by Ag-leaching along coarse grain boundaries. B, Backscatter electron image of a particle in a, showing larger scale zones of Ag leaching (paler, Ag-poor zones) along grain boundaries. C, EBSD IP view across a gold particle from Southland goldfield showing contrasts in grain sizes and Ag contents. D, Incident light view of a particle in C. E,F, Close views of areas of Ag leaching and grain size reduction, as indicated in C. G, Incident light view of a Southland particle with a prominent Ag-poor rim (darker yellow) and extensive irregular and scattered internal Ag-leached patches and fine grains.
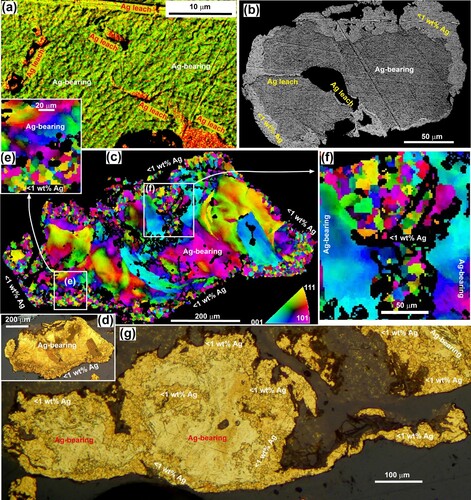
Figure 12. Beach gold on the south coast of the Southland goldfield, in the Round Hill mining area (D). A,B, Gold-bearing heavy mineral concentrates (dark) on an active beach. C,D, SEM backscatter images of detrital gold on an active beach at the mouth of a gold-bearing river. E, Recycled toroidal beach gold in a Pleistocene marginal marine fluvial channel. F, Polished section view of toroids (yellow) with relict Ag-rich cores arrowed. White flakes are platinum. G, Backscatter electron image (modified from Palmer and Craw Citation2023) of a spheroidal toroid with relict Ag-bearing core (dark green, with EDX analytical spots). The image is overlain with Au and Ag element maps to highlight Ag-poor (lighter green) rim and attenuated rim protrusions. H, EBSD crystallographic misorientation map of a toroid, showing variations in grain size (white grain boundaries) and amounts of internal crystallographic misorientations. I, Enlarged view of toroidal rim protrusion in h, showing fine grain size and misorientations.
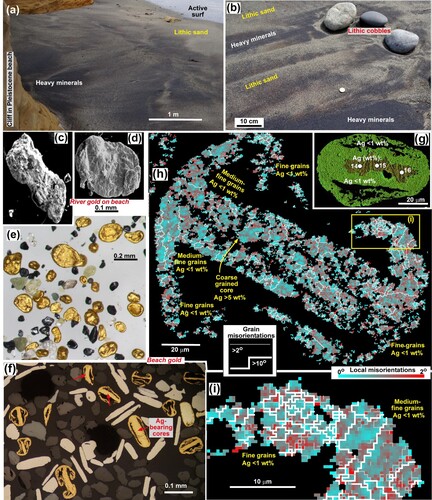
Figure 13. Geochemical models for solubility of Ag and Au. A, Geochemical model (from Geochemists Workbench®) of Ag solubility in chloride solutions, with typical environmental water compositions (green boxes). The main diagram is for moderately oxidised waters; the effects of lower redox conditions are shown at the lower left. B, Backscatter electron image of authigenic silver (Ag) on clay at Round Hill placer mine, south coast (D). C, Solubility of gold in near-surface environments (modified from Craw and Lilly Citation2016).
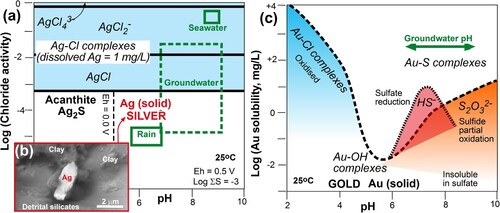
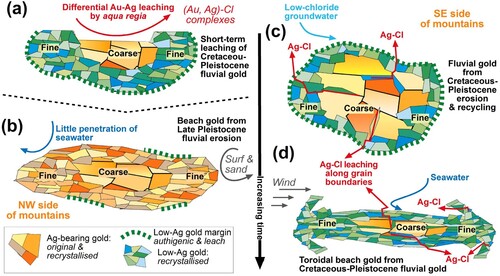
Figure 14. A, Differential chloride leaching of Au and Ag by aqua regia (e.g. B). B, Young Southern Alps beach gold has resisted Ag leaching and is frequently buried out of the wind by surf and sand. C, Otago-Southland fluvial gold has progressive Ag leaching along grain boundaries (e.g. ). D, Southland beach toroid with enhanced Ag leaching during wind-driven deformation.
Data availability statement
All data are included in this paper and cited references.