Figures & data
Figure 1. Distribution of green turtle records from New Zealand from 1895 to July 2013 (n = 194). Stranded turtles (○); Sightings (♦); Incidental captures (▴).
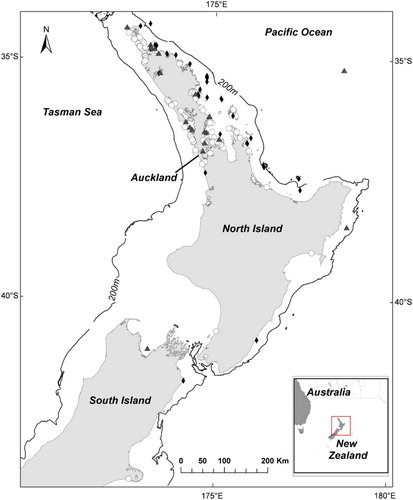
Figure 2. Size-class frequency distribution of green turtles in New Zealand recorded from 1895 to 2013. Mean curved carapace length (CCL) = 51.9 cm (SD ± 11.6 cm, n = 86).
Figure 3. Predicted means from a Poisson generalised linear model of the number of sightings and strandings per quarter for 2014, assuming typical temperatures. Error bars represent 95% confidence intervals around the means. A, West coast strandings; B, east coast strandings; C, east coast sightings and captures.

Table 1. Analysis of deviance table for a Poisson generalised linear model of the number of green turtle records.
Table 2. One-way ANOVA comparing curved carapace length (CCL) of stranded turtles and the seasons in which they were recorded (Jan–Mar, Apr–Jun, Jul–Sep, Oct–Dec; n = 76).
Figure 4. Predictions from a Poisson generalised linear model of the mean of the quarterly counts of turtle records between 1983 and 2013. Circles represent the number of counts recorded, the black lines are the predicted means, and the grey areas show the 95% confidence bounds for the means. A, West coast strandings; B, east coast strandings; C, east coast sightings and captures.