Figures & data
Figure 1. A process for developing a Cultural Flow Preference Study and utilising this process to inform flow management decisions (adapted from Tipa and Nelson Citation2008; Tipa and Severne Citation2010). The focus of the present study is on Step 6.
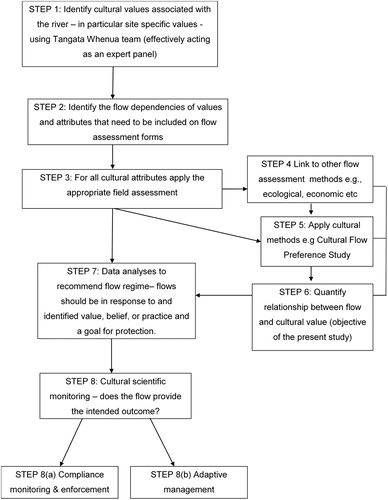
Table 1. An example of cultural themes and their attributes, and the overall health scores used in the Cultural Flow Preference Studya.
Figure 2. An overview of the dataset and the types of analyses completed during a Cultural Flow Preference Study (Tipa Citation2013).
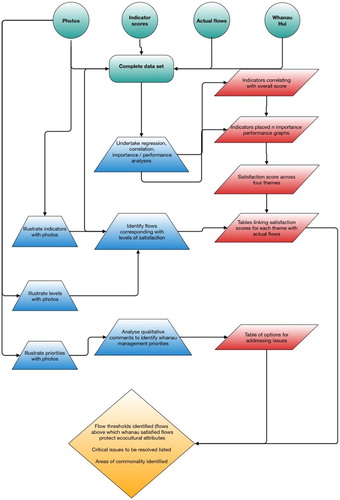
Figure 3. Locations of the five streams selected by whanau for the present study: Selwyn River (black square), Irwell River (grey circle) Buchannan’s Creek (black triangle), Merrys Stream (grey diamond), Waikouaiti River (black circle).
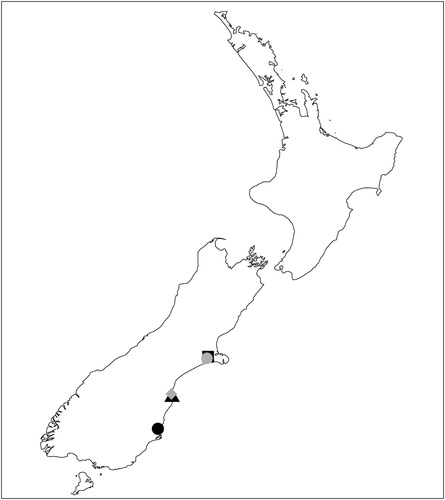
Table 2. Site and gauging station details.
Figure 4. Recorded flows on the day of each visit for each site, compared to the 7-day mean annual low flow (MALF) and median flow.

Figure 5. Observed and fitted relationships between overall health score and river flow. Dots represent observed values. Light grey lines represent calculated values at the site level. Dark grey lines represent calculated values at the assessor level within site level.
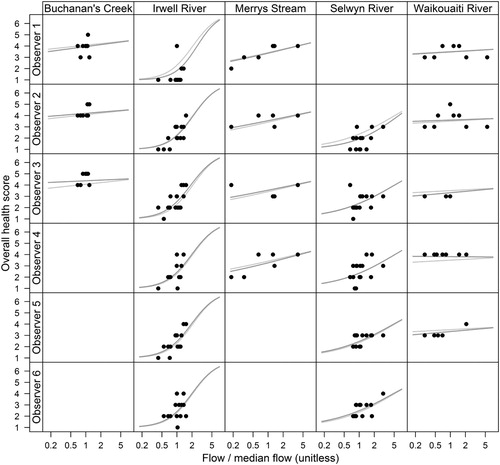
Figure 6. Performance of mixed-effects models for the relationship between overall health and flow at different levels of resolution. Although scores ranged from 1 to 7, we show only observed vs. predicted relationships between 1 and 5 because this is the range of observations that were recorded. Thick dashed grey line represents linear regression. Thin dashed grey line represents the 90% confidence prediction interval. Data have been jittered to avoid overplotting of symbols.
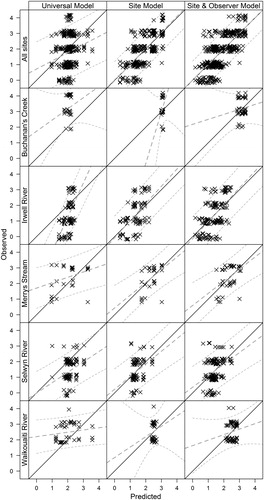
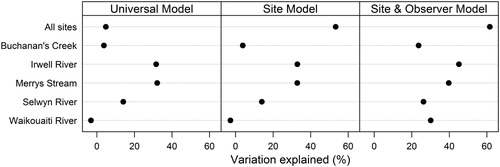
Figure 7. Percent variation explained for models for the relationship between overall health and flow at three nested levels of the mixed-effects model for each site separately and all data pooled together.