Figures & data
Figure 1. Summary of analysis steps to predict current and reference Trophic Level Index (TLI) values for 1031 lakes in New Zealand. Acronyms are defined in the text.
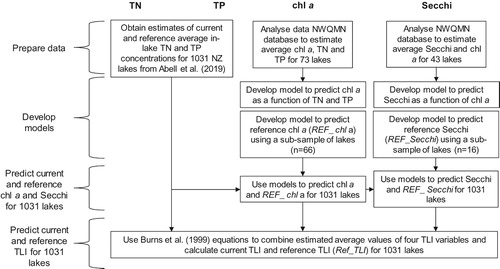
Table 1. Summary of NWQMN lake water quality data used to develop models to predict annual mean chlorophyll a (chl a) concentrations and annual mean Secchi depth (Secchi).
Figure 2. Locations and geomorphic type of the 1031 lakes for which current and reference Trophic Level Index values were estimated in this study. Adapted from Abell et al. (Citation2019).
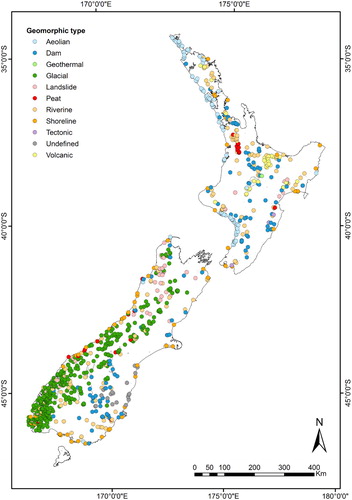
Table 2. Summary of models used to predict current and reference state values of chlorophyll a and Secchi depth in 1031 New Zealand lakes.
Table 3. Summary of estimated values of Trophic Level Index (TLI) variables for 1031 lakes.
Figure 3. Predicted TLI for 1031 New Zealand lakes corresponding to current and reference states. Vertical lines denote 95% confidence intervals. Lakes are ordered by ascending current TLI values.
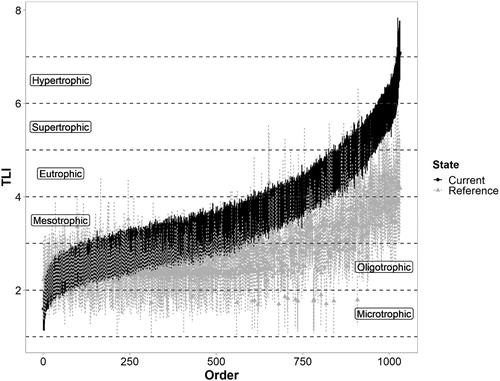
Figure 4. Estimated TLI for New Zealand lakes corresponding to reference and current conditions, differentiated by lake geomorphic type. Sample sizes are shown in parentheses. Only types with sample size ≥25 are presented and lakes with an undefined geomorphic type (n = 42) are not shown.
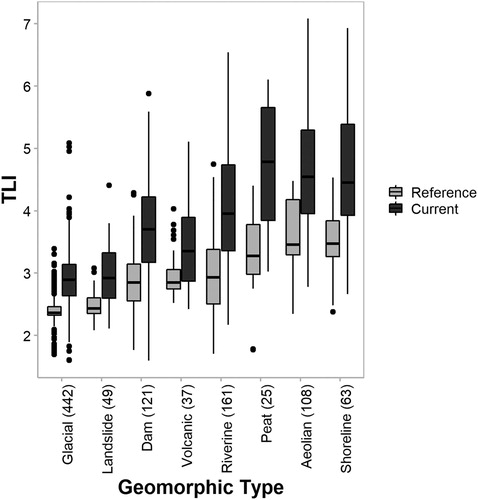
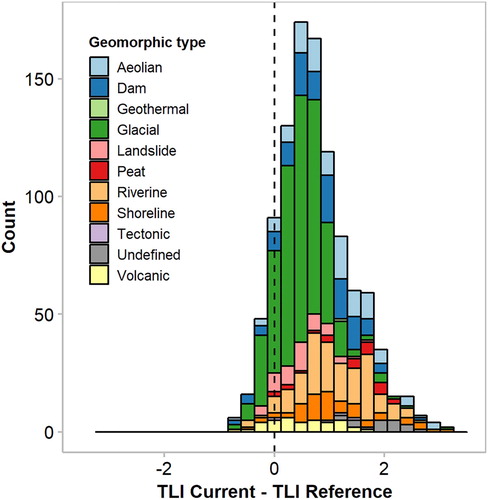
Figure 5. Frequency (counts) distribution of estimated departure from reference Trophic Level Index (TLI) for 1031 New Zealand lakes categorised based on geomorphic type.