
Figures & data
Figure 1. Bay of Islands, showing places mentioned in text and location on the North Island of New Zealand.
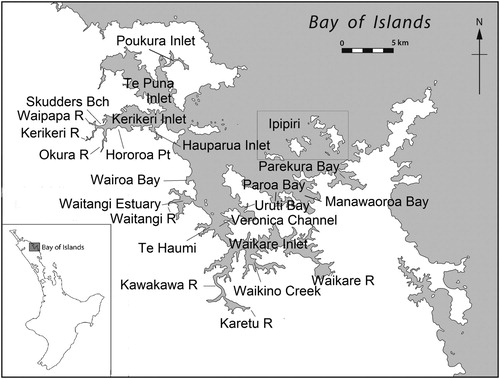
Table 1. Surface area (ha) of mangroves in the Bay of Islands in 1950–53 (orthorectified images given in Table S1) compared with 2009.
Figure 2. Changes in mangrove cover in Parekura Bay, 1922–2009, boxed-mangroves in the 1922 and 1942 maps presumably representing the tree-line visible in 1951. During rapid infilling and consolidation of new recruits, initial individual trees remained discernible.
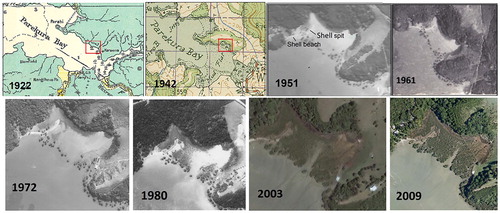
Figure 3. Mid-Kerikeri Inlet in 2009, the geomorphology apparently having changed little over the previous 170 y, but for shoaling (Figure S10). The main extent of the cockle beds in 2018–19 are indicated by yellow vertical lines; orange vertical lines denote areas of deep mud essentially devoid of cockles. MB, Middle Bank; PIC, Pickmere Channel; SS, South Shore.
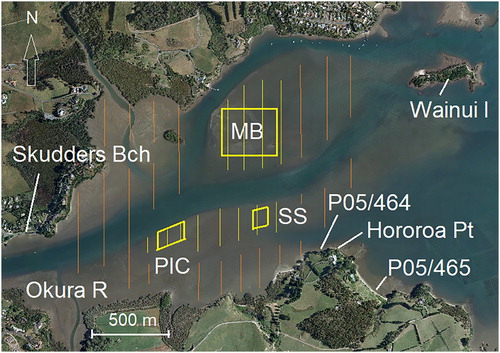
Figure 4. For Hororoa Point cockles, mean size (mm length ± 1 SD) (left), mean second full-year’s growth (mm height ± 1 SD) (middle), and mean third full-year’s growth (mm height ± 1 SD) (right). MB, Middle Bank (December 2018); PIC, Pickmere Channel (April 2019); SS, South Shore (January 2019); middens P05/464 and P04/465 (December 2018, using cockles 25–35 mm long), the length ranges given on the archaeological Site Record Forms being 35–51 mm and 34–54 mm respectively (Table S8).
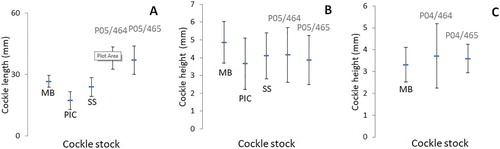
Figure 5. Length frequencies by year (2009-19) for cockles sampled during April at Pickmere Channel, Kerikeri Inlet (Griffiths, pers. comm. 2019; author’s unpubl. data).
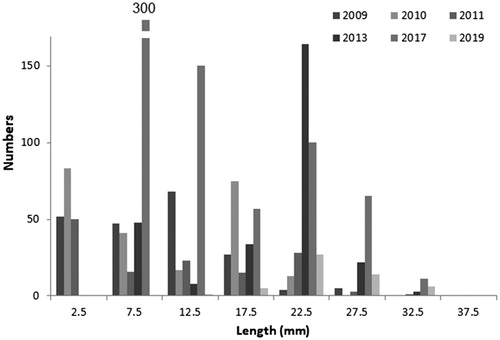
Figure 6. Length ranges of midden cockles reported on archaeological site record forms (A, with numbers of middens shown on the map according to Booth’s [Citation2016] archaeological compartments), and recent (since 2009) living cockles (B and C, with sampling sites indicated by dots; Table S3, with the author sieving to 2 mm, but others’ mesh sizes varying) for the Bay of Islands; each vertical line denotes maximum and minimum cockle lengths for a particular locality. In B, designations a, b and c are beach-wide maximum and minimum values (Berkenbusch and Neubauer Citation2015).
![Figure 6. Length ranges of midden cockles reported on archaeological site record forms (A, with numbers of middens shown on the map according to Booth’s [Citation2016] archaeological compartments), and recent (since 2009) living cockles (B and C, with sampling sites indicated by dots; Table S3, with the author sieving to 2 mm, but others’ mesh sizes varying) for the Bay of Islands; each vertical line denotes maximum and minimum cockle lengths for a particular locality. In B, designations a, b and c are beach-wide maximum and minimum values (Berkenbusch and Neubauer Citation2015).](/cms/asset/ac462475-bf2a-4d29-9db4-933f5865ed19/tnzm_a_1738505_f0006_ob.jpg)