Figures & data
Figure 1. The proportion of īnanga (Galaxias maculatus) in whitebait samples (n ≥ 100 fish) collected over four months from up to 87 rivers around New Zealand.
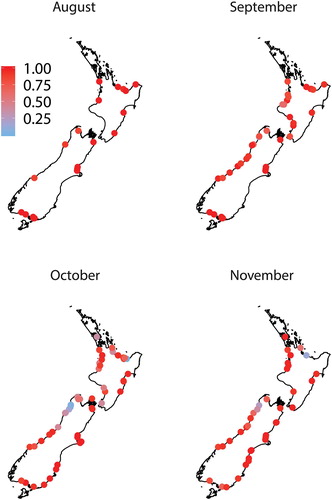
Figure 2. The proportion of banded kōkopu (Galaxias fasciatus) in whitebait samples (n ≥ 100 fish) collected over four months from up to 87 rivers around New Zealand.
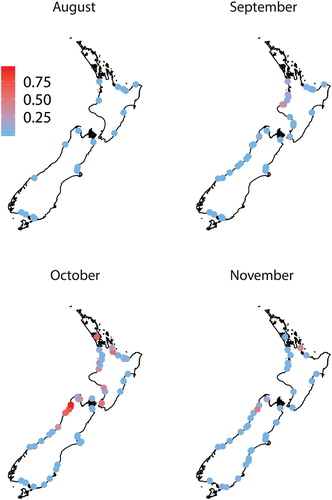
Figure 3. The proportion of kōaro (Galaxias brevipinnis) in whitebait samples (n ≥ 100 fish) collected over four months from up to 87 rivers around New Zealand.
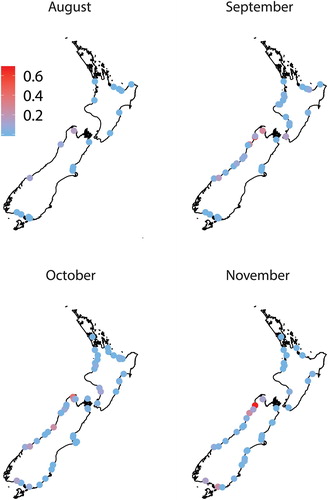
Figure 4. The proportion of giant kōkopu (Galaxias argenteus) in whitebait samples (n ≥ 100 fish) collected over four months from up to 87 rivers around New Zealand.
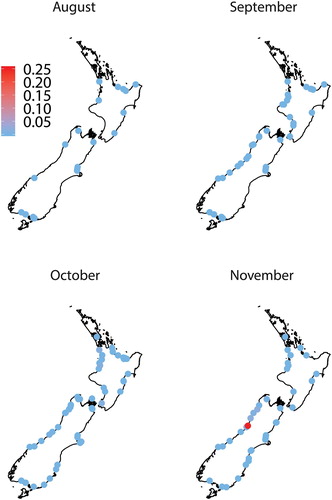
Figure 5. The mean (+SE) proportion (%) of the six whitebait species in samples (n ≥ 100 fish) taken over three months (September–November 2015) from 15 regions of New Zealand. The number of samples is shown at the base of bars in the īnanga panels. ND = no data. Regions are: Auckland (AUK), Coromandel (COR), Waikato (WKO), Bay of Plenty (BOP), Taranaki (TKI), Manawatu-Wanganui (MWT), Hawke's Bay (HKB), Wellington (WTN), Tasman-Nelson (TAS), Marlborough (MBH), Buller (BUL), Canterbury (CAN), Westland (WTL), Otago (OTA), Southland (STL) and all of New Zealand (NZ). Grey bars are regions where enough samples were taken in each month to allow comparisons with ANOVA.
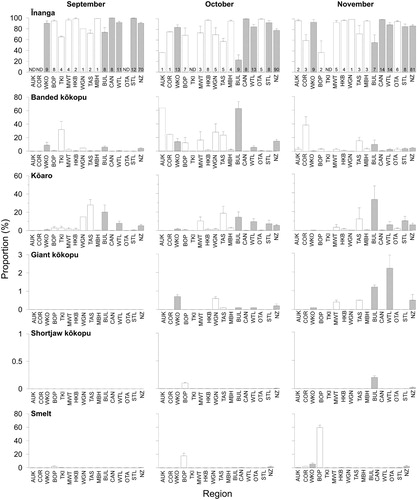
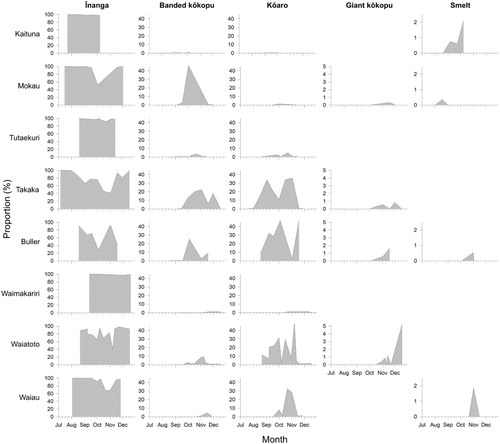
Figure 6. The proportion (%) of five whitebait species in samples (n ≥ 100 fish) taken from eight rivers (plotted from north to south) over up to six months (July–December 2015).