Figures & data
TABLE I Thermal Properties of Stainless Steel AISI316Ti*
Fig. 1. Scheme of the LIVE-3D facility and test vessel.Citation10
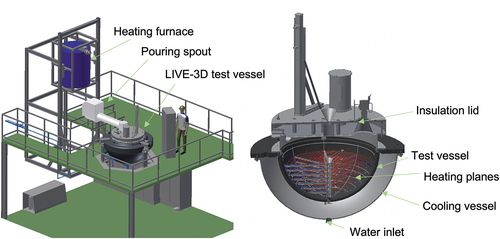
TABLE II Thermal Properties of RIMAX*
TABLE III Thermal Properties of Nitrate Salt*
Fig. 2. Initial debris contour with location of heating planes and thermocouples. Four MTs at one position indicate four thermocouples at the same radius and height, but distributed in 90-deg azimuth intervals.
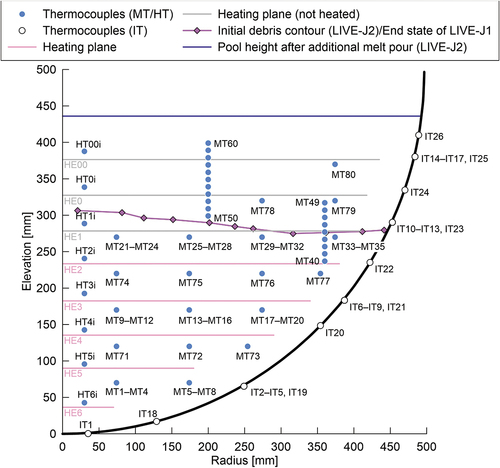
Fig. 3. Initial state of debris bed in LIVE-J2 (end state of LIVE-J1).
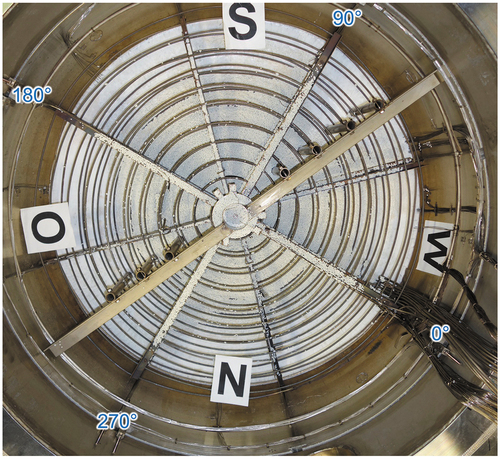
Fig. 4. Test matrix of the LIVE-J test series.
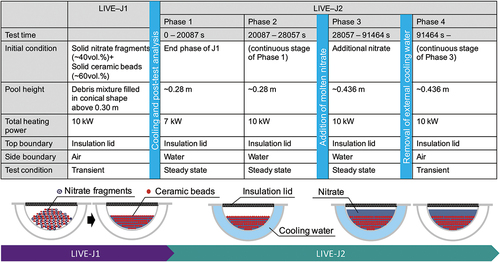
TABLE IV Heating Power of Each Heating Plane in Each Phase
Fig. 5. Melting temperature evolution and power input.
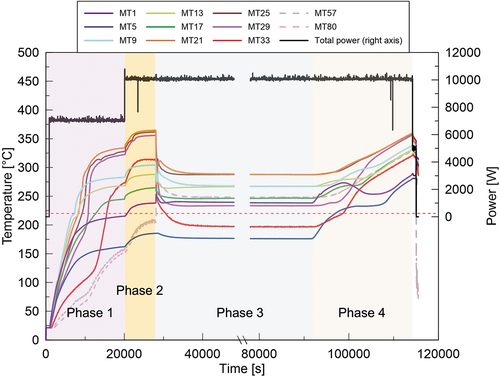
Fig. 6. Melting temperature distribution.
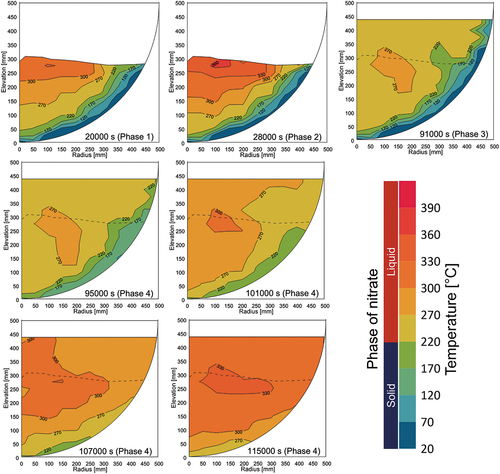
Fig. 7. Vertical melting temperature profile at radius of 74 mm in steady state.
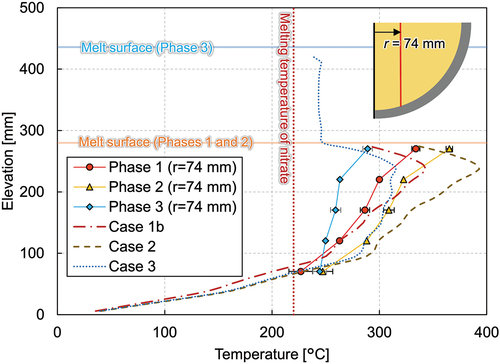
Fig. 8. Vertical melting temperature profile at radii of 360 mm and 374 mm in steady state.
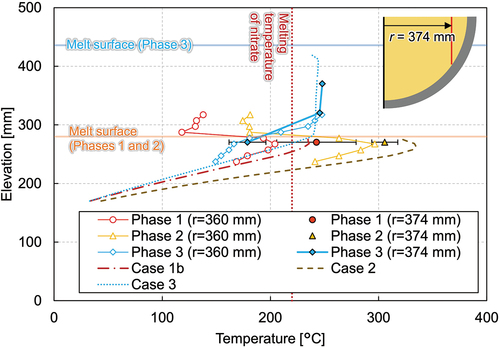
Fig. 9. Horizontal melting temperature profile at elevation of 170 mm.
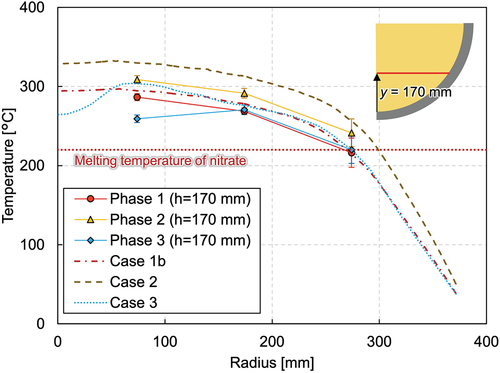
Fig. 10. Crust thickness profile along inner vessel wall.
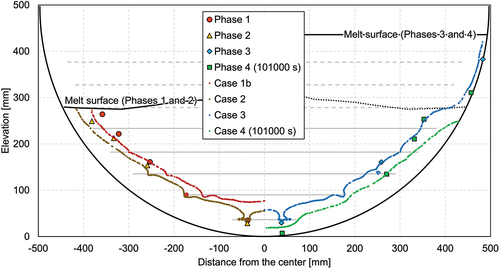
Fig. 11. Inner wall and outer wall temperature profiles along the vessel wall (phase 1).
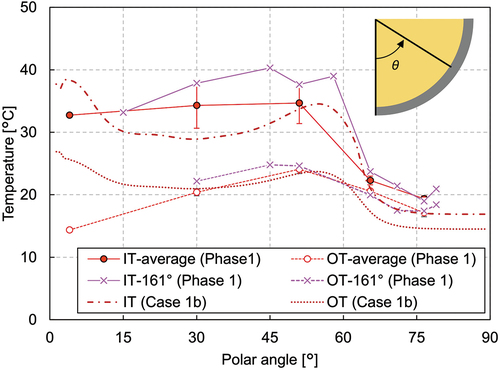
Fig. 12. Inner wall and outer wall temperature profiles along the vessel wall (phase 2).
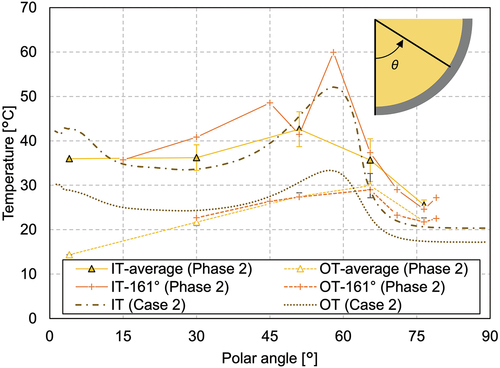
Fig. 13. Inner wall and outer wall temperature profiles along the vessel wall (phase 3).
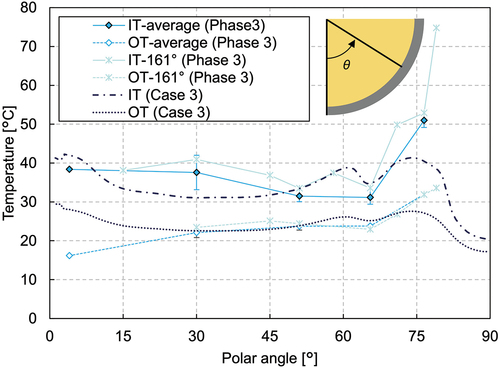
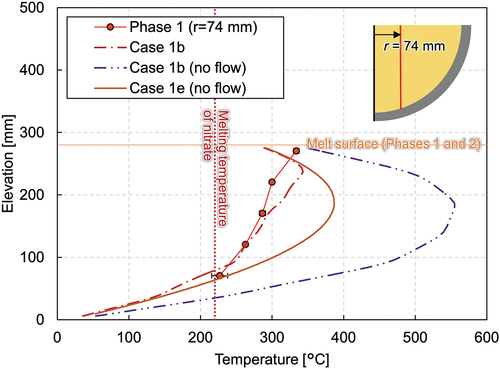
Fig. 14. Vertical melting temperature profile at radius of 74 mm in transient.
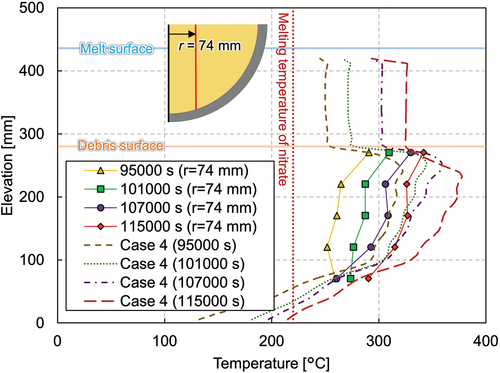
Fig. 15. Vertical melting temperature profile at radii of 360 mm and 374 mm in transient.
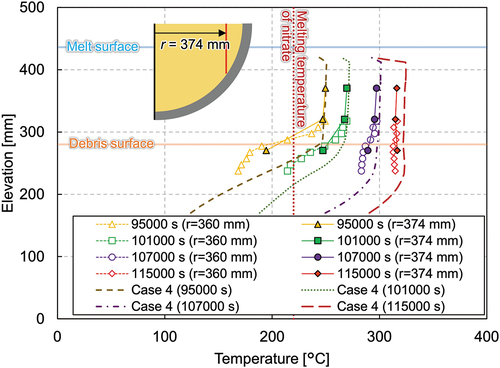
Fig. 16. Horizontal melting temperature profile at elevation of 170 mm.
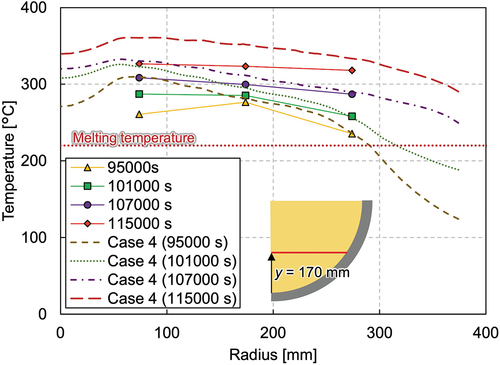
Fig. 17. Inner wall and outer wall temperature profiles along the vessel wall (phase 4).
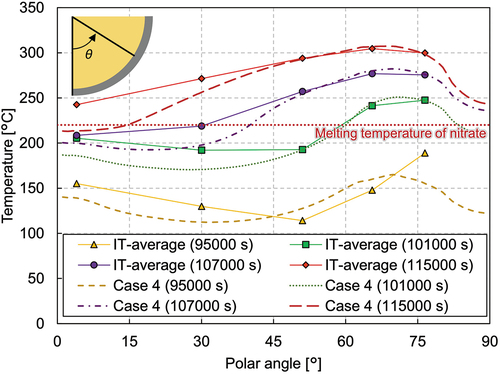
Fig. 18. Graphical representation of the boundary conditions and a cross section of the mesh.
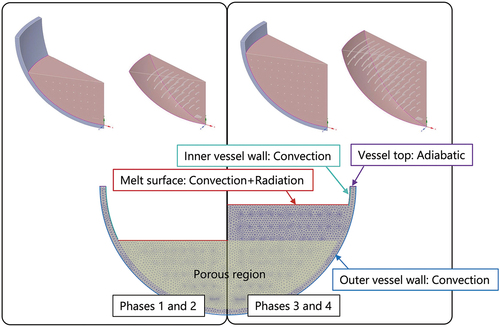
TABLE V Boundary Conditions and Calculation Matrix
TABLE VI Reference Temperatures for Convective and Radiation Boundaries in Phase 4
Fig. 19. Comparison of vertical melt temperature profiles at radius of 74 mm among the different thermal conductivities of the ceramic beads.
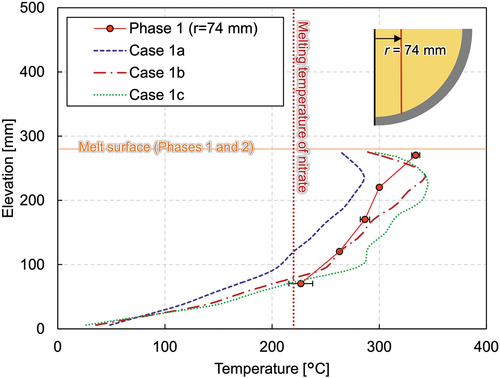
Fig. 20. Calculated temperature contours.
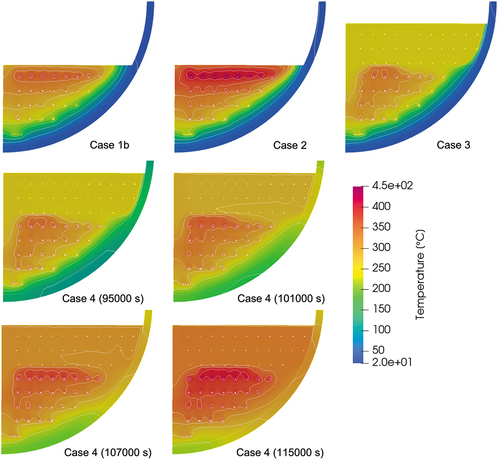
Fig. 21. Calculated velocity contour and vectors.
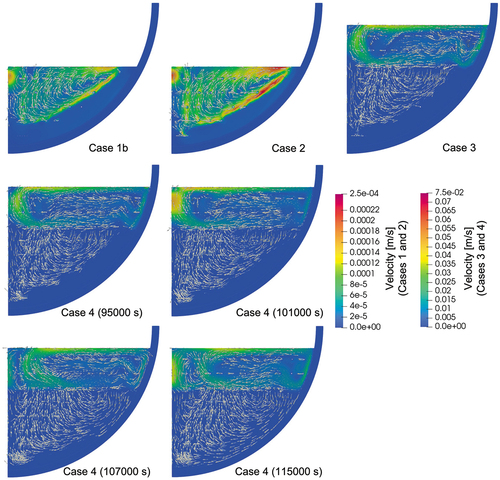
Fig. A.1. Comparison of vertical melting temperature profiles at a radius of 74 mm among different calculation geometries.
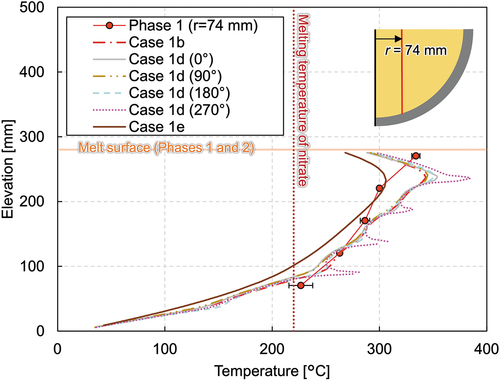
Fig. A.2. Comparison of crust thickness between different calculation geometries—case 1b: sector model, case 1d: full model, and case 1e: full model with homogeneous heating.
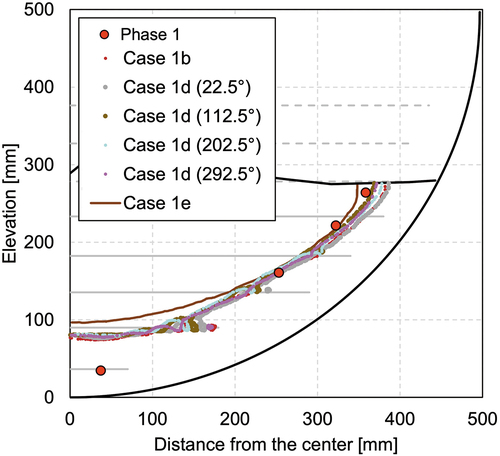
Fig. A.3. Comparison of temperature and velocity contours between the cases with and without heater elements.
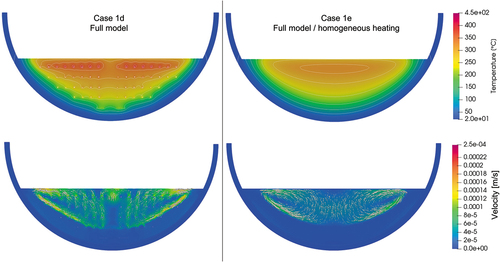
Fig. A.4. Vertical melting temperature profiles at a radius of 74 mm with an assumption of no-flow condition.