Figures & data
Fig. 1. A Pourbaix diagram of chromium species at 300°C. A vertical dotted line corresponds to a neutral pH at 300°C. The image is based on data from CitationRef. 10.
TABLE I Proposed Dopants and Basic Neutronic Data from CitationRef. 15
Fig. 2. The value as a function of time, assuming an equal power density of 100 kW/L for all cases. The reference lattice has dimensions typical for a PWR fuel assembly, whereas the adjusted lattice has a higher H/HM ratio.
TABLE II Used Parameters for the Simulated Pin Cell Lattices
Fig. 3. Achievable cycle length of the doped UN fuels, relative to that of pure UN fuel, as a function of the fraction of dopant. The relative cycle length achievable with pure UO2 fuel is also shown for comparison.
TABLE III Parameters for the Production of Doped UN
Fig. 4. SEM/EDS images showing the elemental distributions on the surfaces of the air-dried spheres of UN doped with (a) chromium, (b) aluminum, and (c) nickel, respectively.
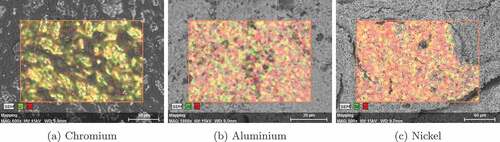
Fig. 5. SEM/EDS images showing the elemental distributions on the surfaces of the nitrided spheres of UN doped with (a) chromium, (b) aluminum, and (c) nickel, respectively.
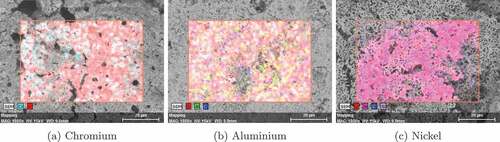
Fig. 6. SEM/EDS images showing the elemental distributions on the surfaces of the sintered pellets of UN doped with (a) chromium, (b) aluminum, and (c) nickel, respectively.
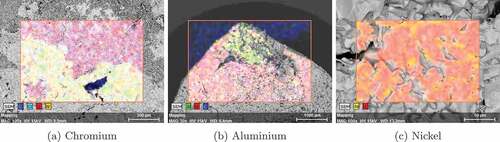
TABLE IV Densities of the Doped UN Pellets
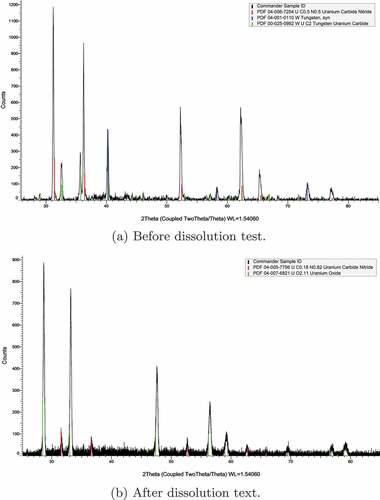
Fig. 7. XRD pattern indicating the presence of different compounds at the surface of the chromium-doped UN pellet (a) before and (b) after the dissolution test.