Figures & data
Fig. 1. CNRS benchmark results.
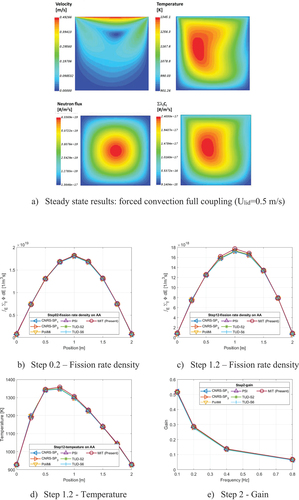
TABLE I Design Parameters for the Reference MCFR Considered in the Present Study
TABLE II Fuel Salt and Structural Material Properties
Fig. 2. Simulation domain of the reference MCFR: (a) reactor vessel dimension and (b) reference MCFR system.
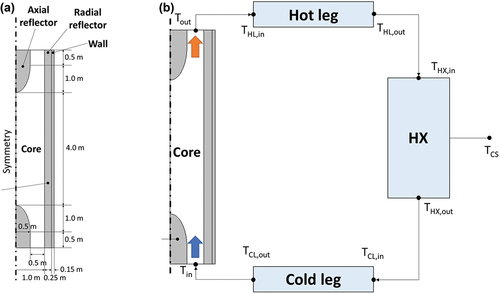
Fig. 3. Mesh convergence results.
Fig. 4. Steady-state simulation results of the reference MCFR.
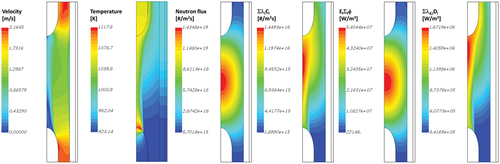
Fig. 5. Locations of monitoring points.
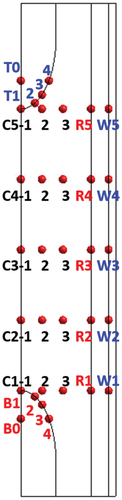
Fig. 6. Temperature evolution in the core during ULOF.
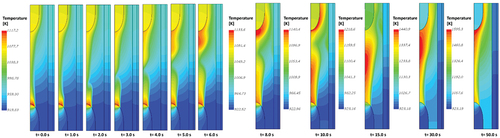
Fig. 7. Local temperature evolution of the fuel salt and core components during ULOF.
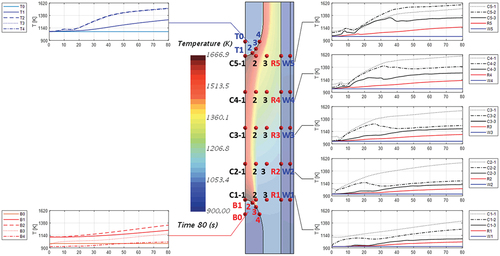
Fig. 8. Temperature evolution in the core during ULOHS.
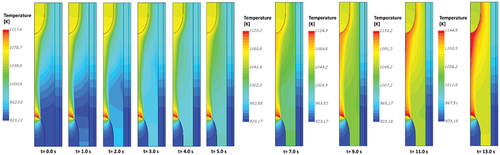
Fig. 9. Local temperature evolution of the fuel salt and core components during ULOHS.
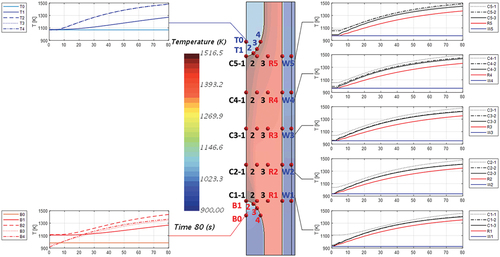
TABLE III Maximum Temperature of the Core Components at 80 s During Unprotected Transients
Fig. 10. Comparison of temperature evolution during flow rate fluctuation transients for the periods of 0.5- and 5.0-s cases.
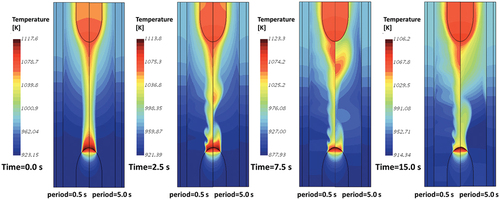
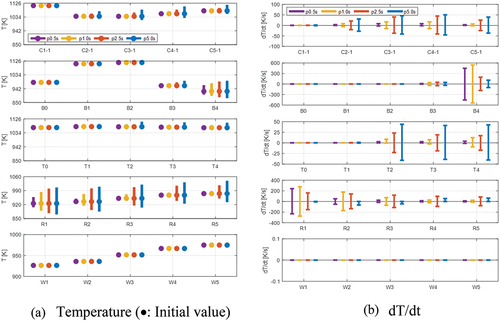
Fig. 11. Temperature range and temporal temperature change of reactor structures during flow rate fluctuation transients: (a) temperature (•: initial value) and (b) dT/dt.
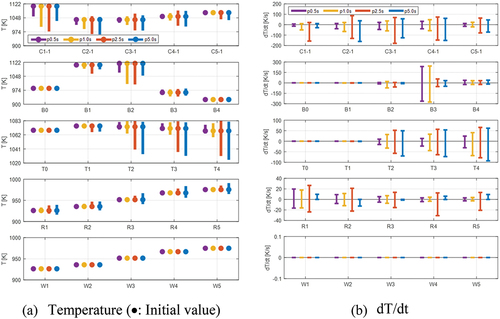
Fig. 12. Temperature evolution during heat sink fluctuation transients.
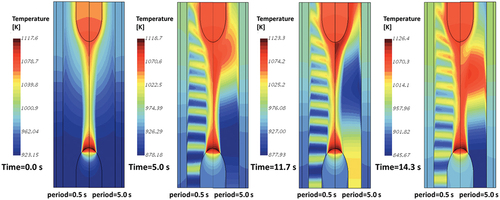
Fig. 13. Temperature range and temporal temperature change of reactor structures during heat sink fluctuation transients.