
Figures & data
TABLE I Compositions and Results of COLOSS Samples*
Fig. 1. A UO2 fuel pellet inserted in Zircaloy-4 rings in order to reproduce on a single-pellet size the geometry of a real LWR fuel element.
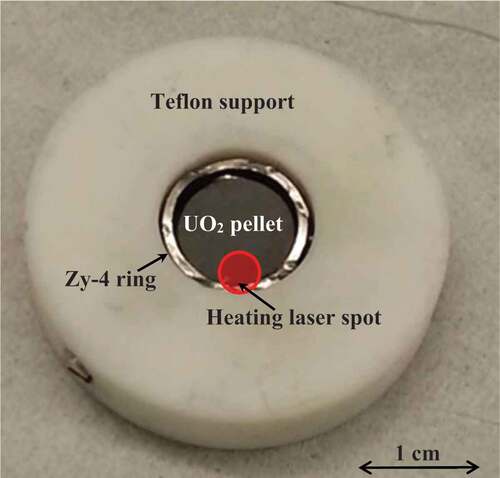
Fig. 2. Laser-heating facility at JRC Karlsruhe.
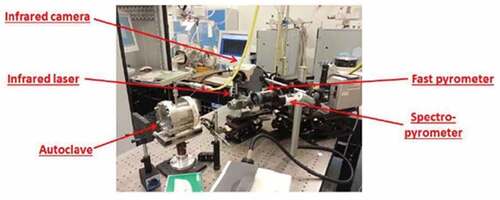
Fig. 3. Example of a thermogram of the UO2-Zr system, where the start and the end of the solidification, as well as the undercooling, are highlighted. Source: OECD (2021) (CitationRef. 11).
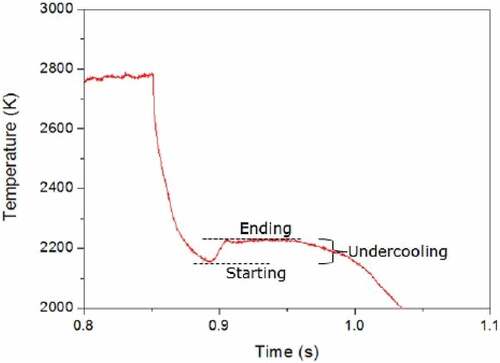
Fig. 4. Comparison between the computed thermodynamic model of the Zr-UO2 system proposed by Quaini et al.Citation7 and the melting temperature of the COLOSS samples in inert atmosphere (Ar). Temperature and composition uncertainty bands reported in are not plotted here. Source: OECD (2021) (CitationRef. 11).
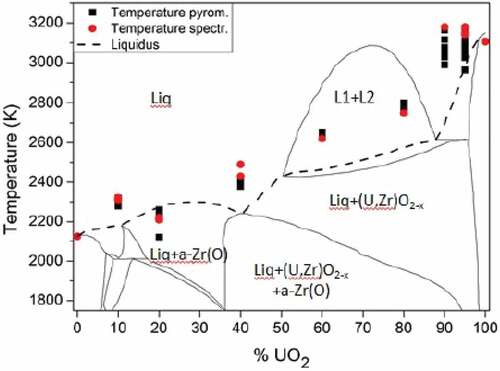
Fig. 5. Comparison between the computed thermodynamic model of the Zr-UO2 system proposed by Quaini et al.Citation7 and the melting temperature of the COLOSS samples in reducing atmosphere (Ar + 6% H2). Temperature and composition uncertainty bands reported in are not plotted here. Source: OECD (2021) (CitationRef. 11).
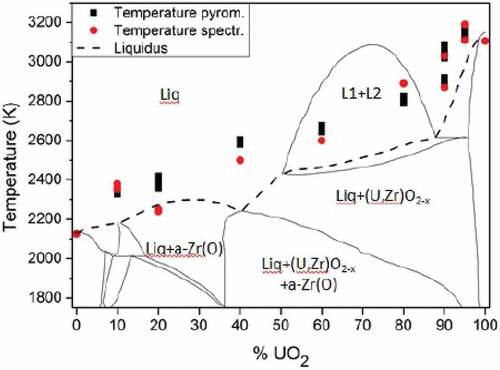
TABLE II Compositions of Phases Referred to from EDX Analysis (Excluding O)*
Fig. 6. SEM images of COLOSS-10 in three regions of the melted area. The compositions of the indicated phases are reported in . Source: OECD (2021) (CitationRef. 11).
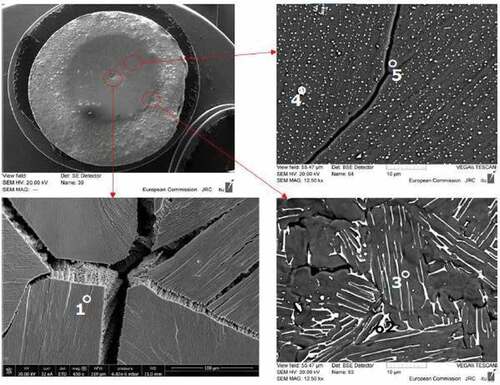
Fig. 7. (a) SEM image of COLOSS-20, where a dark Zr ring appears around the melted area and (b) zoom in the periphery of the melted area, with the evolution of Zr (light blue) and U (violet) composition along the line. Source: OECD (2021) (CitationRef. 11).
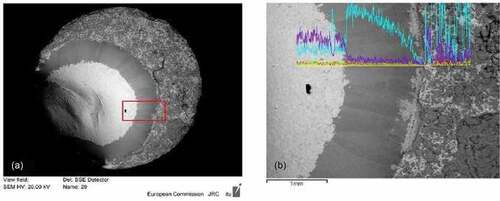
Fig. 8. Comparison between the thermograms obtained by two different pyrometers, one monochromatic and one multichannel (here referred to as Pyrometer and Spectrometer, respectively), during the melting of a UO2 fuel sample mounted inside a real Zircaloy-cladding ring. Source: OECD (2021) (CitationRef. 11).
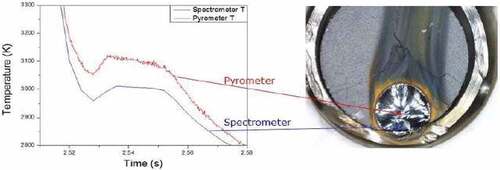
Fig. 9. Comparison between the thermograms obtained by the monochromatic pyrometer focused in the middle of the melted spot of a UO2 fuel sample mounted inside a Zircaloy-cladding ring in inert atmosphere after (a) the 1st laser pulse and (b) after the 16th laser pulse. Source: OECD (2021) (CitationRef. 11).
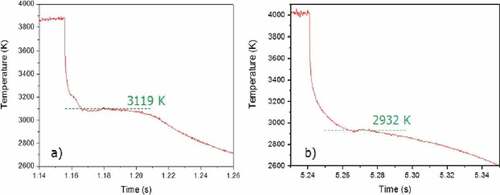
Fig. 10. Evolution of the observed melting temperature after each laser pulse, in inert (pressurized Ar) and reducing (pressurized Ar + H2) conditions. The pictures on the right show the samples after the melting/freezing experiments in the two cases. Temperature uncertainty bands are not plotted here. Source: OECD (2021) (CitationRef. 11).
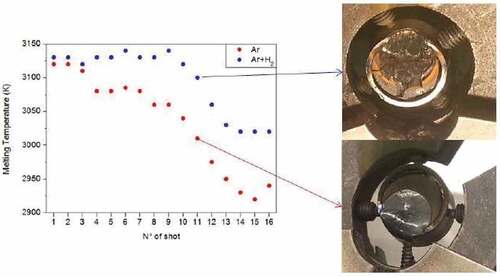
TABLE III Compositions of Phases Referred to by EDX Analysis (Excluding O)*
Fig. 11. SEM images of (a) the posttreatment sample in realistic geometry and (b) zoom in the periphery area. The composition of the selected point is reported in . Source: OECD (2021) (CitationRef. 11).
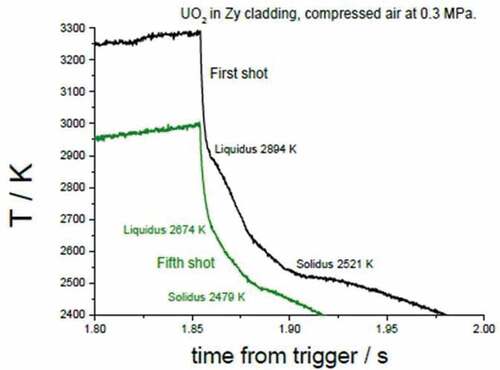
Fig. 12. Thermograms of the first and fifth pulses in a series of eight laser thermal cycles performed on UO2 fuel sample mounted inside a real Zircaloy-cladding ring under compressed air at 0.3 MPa. Source: OECD (2021) (CitationRef. 11).
Data Availability Statement
Raw data were generated at JRC Karlsruhe. Derived data supporting the findings of this study are available from the corresponding author (D. M.) on reasonable request.