
Figures & data
Table
TABLE I Parameter Distributions for the Slab Benchmark
Fig. 1. 100 snapshots for the slab benchmark.
Fig. 2. Normalized singular values using 100 snapshots.
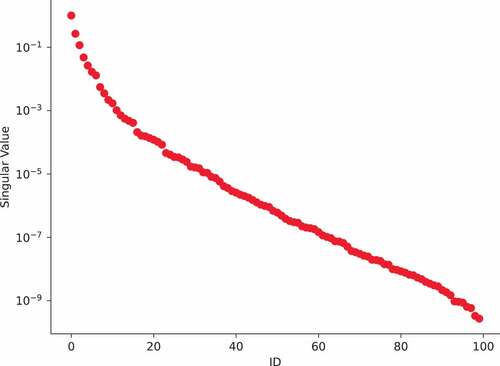
Fig. 3. Relative error norm of the ROM as a function of the number of basis vectors used for the slab benchmark. The boxes show the quartiles of the 100 relative error norms, while the whiskers extend to show the rest of the distribution.
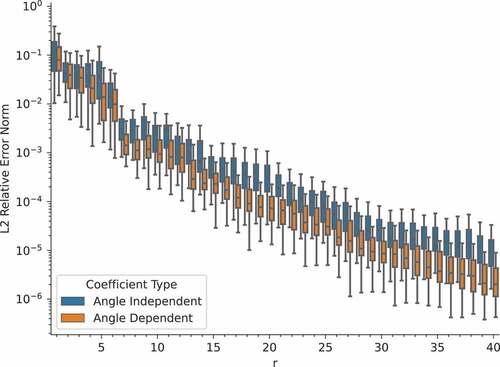
Fig. 4. Speedup of the ROM as a function of the number of basis vectors used for the slab benchmark.
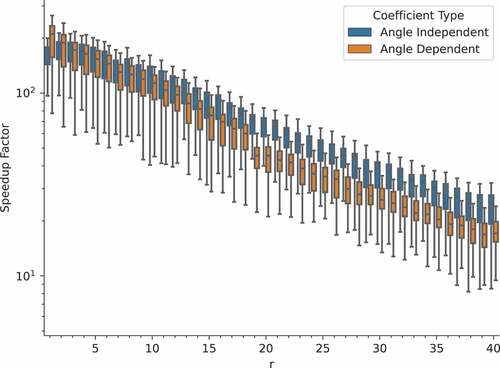
Fig. 5. ROM pointwise relative error (40-mode angle-dependent ROMs); 100 testing parameter realizations shown. Maximum pointwise error is 1.7%.
Fig. 6. Checkerboard benchmark geometry. The source material has the same cross sections as the scattering material.
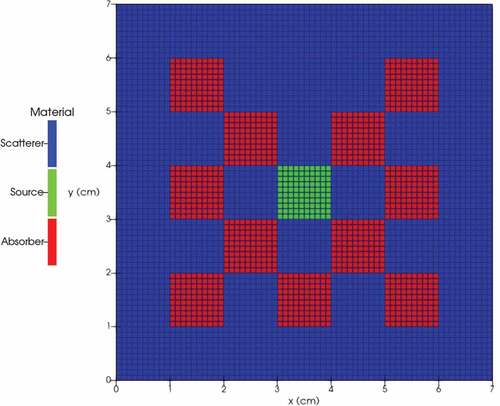
TABLE II Parameter Distributions for the Checkerboard Benchmark
Fig. 7. Full-order solutions for three of the snapshots. Parameter vectors are reported as .
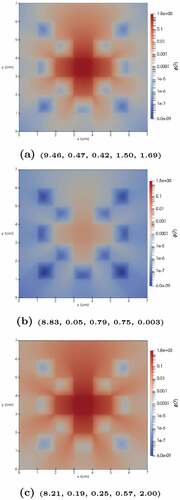
Fig. 8. Normalized singular values of the angular snapshots for each octant of the 300 snapshots, along with the singular values of the flux moment snapshots.
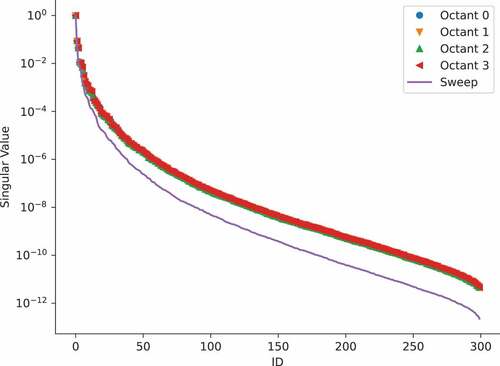
Fig. 9. Relative error norm of the ROM as a function of the number of basis vectors used for the checkboard benchmark.
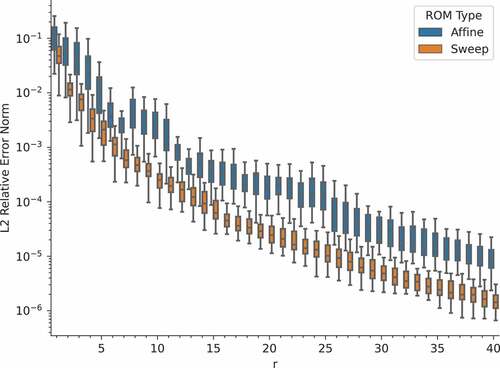
Fig. 10. Speedup of the ROM as a function of the number of basis vectors used for the checkerboard benchmark.
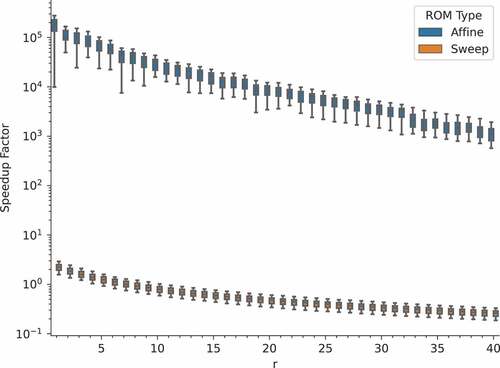
Fig. 11. ROM pointwise relative error for one of the 50 validation parameter realizations (affine-decomposed ROM).
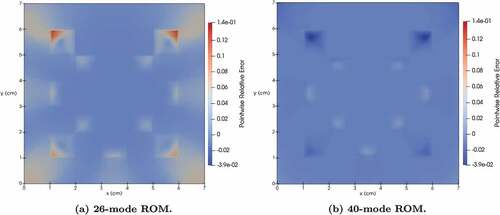
Fig. 12. Graphite benchmark geometry.
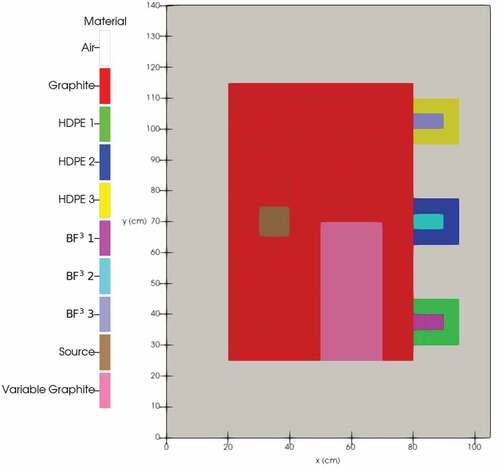
Fig. 13. Full-order solutions for three of the snapshots. The top and bottom rows correspond to energy groups 9 and 12, respectively, while each column corresponds to a snapshot. Parameter vectors are reported as quadruplets of boron fraction 1, boron fraction 2, boron fraction 3, and variable graphite density.
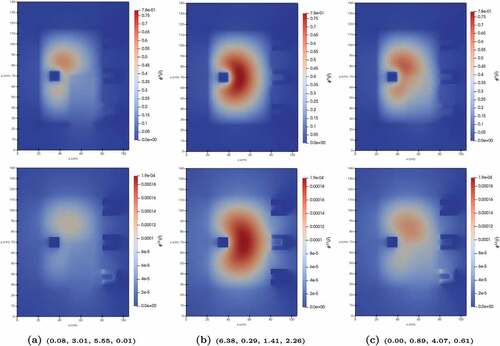
Fig. 14. Normalized singular values of the energy- and direction-agglomerated angular snapshots.
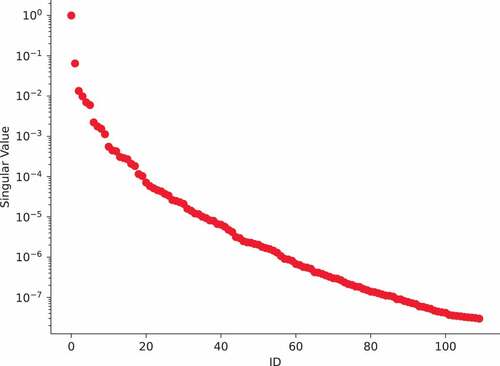
Fig. 15. Relative error norm of the ROM as a function of the number of basis vectors used for the graphite benchmark.
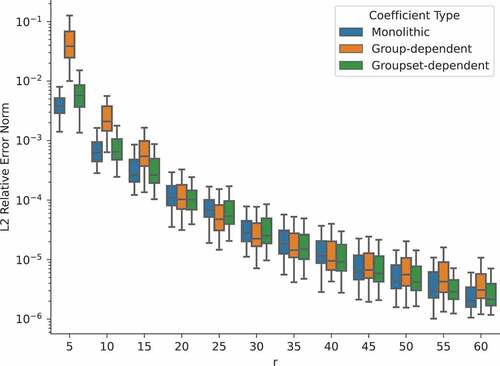
Fig. 16. Speedup of the ROM as a function of the number of basis vectors used for the graphite benchmark.
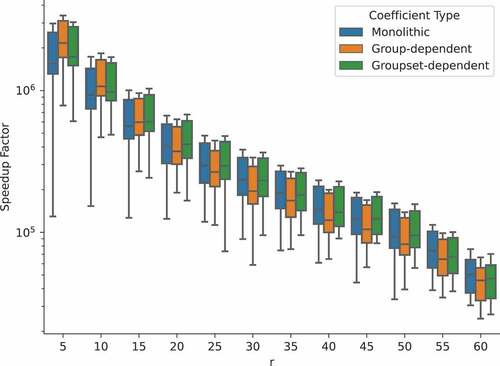
Fig. 17. RoI relative error norm of the ROM as a function of the number of basis vectors used.
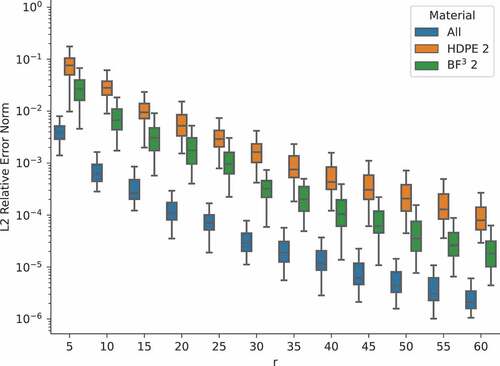
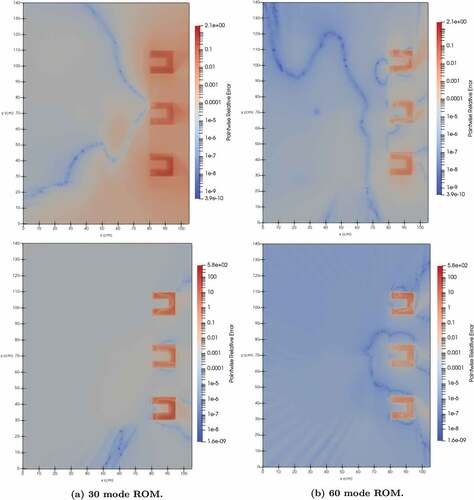
Fig. 18. Pointwise relative error for one of the 100 validation parameter realizations. The top and bottom rows correspond to energy groups 9 and 12, respectively, while each column corresponds to the rank of the ROM.
Table
Table
Table
Table